
Author: Alexander Willemsen, Degree of Master of Science of Engineering
Based on a paper authored by Eric Bretschneider, Ph.D.
The Circadian Stimulus (CS) model is one of the most well-known models for quantifying the circadian impact of lighting. One striking feature that separates the model from other contemporary circadian lighting models is its discontinuous action spectrum. As a consequence, the predicted circadian impact of luminaires can vary greatly between spectrally similar luminaires, or for a single luminaire subject to temporal changes in spectral properties. It is currently not sufficiently understood which region of spectral properties are affected by the discontinuity. This article is a summary of an article by Eric Bretschneider which was recently published in Lighting Research & Technology [Bretschneider 2025]. It provides a deeper examination of the metameric locus of the CS model – the region susceptible to unstable results due to the discontinuity. The article presents previous research on identifying the metameric locus as well as providing new simulation results. Approximate limits of the metameric locus within the CIE 1931 chromaticity space are presented. Additional factors which can affect the chromaticity of luminaires are also considered, and applied to present an extended metameric locus, which includes a major portion of the CCT values typically used in luminaires. As a result, many commercial luminaires could potentially be affected by the CS model discontinuity, including most cool and neutral white lights.
Main article
Circadian lighting models are used to predict the effect of light on human circadian rhythms. These models are based on action spectrum and are typically quantified by the expected nocturnal melatonin suppression. The circadian stimulus (CS) model is based on a retinal circuit diagram and the hypothesis that ipRGCs as well as all four classical photoreceptors play a role in circadian phototransduction [Rea 2021]. Importantly, all iterations of the CS model incorporate a blue-yellow opponency (BYλ) function in the retinal circuit. The BYλ function acts in a diode-like matter and switches the circadian phototransduction mechanism between two distinct states based on whether the sign of the BYλ function is positive or negative. This results in the CS model having a discontinuous action spectrum. The predicted effect of two otherwise similar spectral power distributions (SPDs) can differ significantly if the sign of the BYλ function is different.
The BYλ function is evaluated for wavelengths between 380 nm and 730 nm and is defined as:
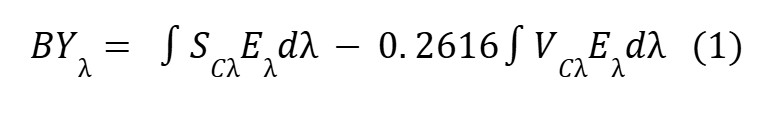
where:
SCλ = S-cone fundamental corrected for macular pigment transmittance
VCλ = photopic response function corrected for macular pigment transmittance
Eλ = corneal irradiance [W/m2/nm]
The CS model includes two metrics: circadian light (CLA) and circadian stimulus (CSlogistic). CLA is normalised so that 1000 lx of illuminant A yields CLA = 1000 lx. CSlogistic is calculated as a logistic function of CLA and represents the predicted percent of nocturnal melatonin suppression based on 1 h of exposure. Figure 1 shows the action spectra for two different versions of CLA using monochromatic lights. The constant criteria used for each wavelength is CLA = 355.7 lx, which corresponds roughly to CSlogistic = 0.35, a criterion used in the CS model papers. The discontinuity at 497 nm demonstrates the shift in sign of the BYλ function leading to a doubling of the luminous efficiency needed to reach the same CLA. A change in the sign of the BYλ function can change the value of CLA by a factor of two, and the predicted percent of nocturnal suppression can differ by up to 13%. There is a direct correlation between CLA and the energy required for lighting to achieve a desired circadian lighting effect, meaning that a change in sign of the BYλ function can double the energy requirement.
Despite the CS model being proposed in 2005 and having gone through multiple iterations since, no studies clearly identifying the locus of BYλ metamers of the CS model have been conducted. The term BYλ metamers is used here to refer to light metameric light sources – sources with different spectral properties that are perceived similarly – that differ in sign of the BYλ function. This locus is important as imperceptible changes to the SPD of a light can switch between the modes of the CS model and yield significantly differences in the predicted CLA value and hence CS value. Absent a clear understanding of the chromaticity locus associated with the discontinuity of the BYλ function, lighting designers cannot ensure that a given lighting scenario has a stable and consistent circadian impact based on the CS model.

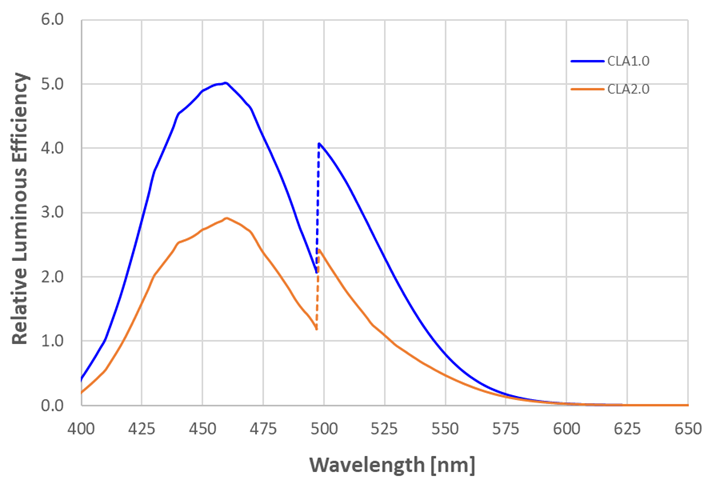
Figure 1: The unnormalized action spectra for two versions of CLA using per wavelength monochromatic lights and a constant criterion of CLA = 355.7 lux. The discontinuity in both versions is caused by the shift between the blue and yellow modes of the CS model, i.e., a change in sign of the BYλ function.
A review of literature shows that the BYλ metameric locus has been tentatively identified to correspond to an approximate CCT of 3500 K [Esposito 2022], however CCT by itself is insufficient as it only specifies one dimension of the two-dimensional chromaticity gamut, the other necessary metric being Duv. Esposito and Houser identified BYλ metamers using five channel luminaires with random channel settings. This work showed the potential for light sources within the ANSI 3500 K chromaticity bin to switch between blue-dominant and yellow-dominant due to ageing effects or environmental interactions. Li et al. [Li 2022] conducted a similar study and reported BYλ metamers existed in at least portions of ANSI bins for nominal CCT values of 3000 K, 3500 K, and 4000 K. Li et al. also discussed potential issues with the sensitivity of the CS model with respect to small changes in SPD due to factors like temperature fluctuations, changes in transmittance of luminaire optics, and even calibration of the instruments used to measure SPDs.
Both Esposito and Houser and Li et al. were based on colour-tuneable luminaires with at least 5 independent channels, which represent a minority of fixtures. To provide better guidance and a more detailed analysis of the BYλ metameric locus, this work used a database of 2019 measured SPDs including natural sources, incandescent, fluorescent, and SSL products. An initial analysis was done by calculating the value of the BYλ function for each of the SPDs to determine the approximate range of CCT values where the values of the BYλ function was close to zero. The results shown in Figure 2 indicated that the BYλ metameric locus could potentially extend from about 2700K to about 3800 K.

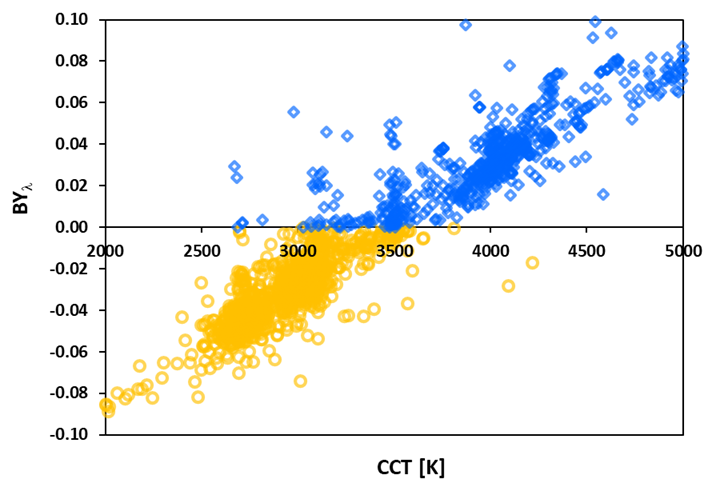
Figure 2: BYλ as a function of CCT for the 2019 SPDs at 300 lx.Positive BYλ values are plotted in blue, and negative BYλ values are plotted in yellow.
A Monte Carlo simulation was run using 1.5 million SPDs generated by combining 2 to 5 SPDs from the core dataset with random intensities. Chromaticity coordinates CCT and Duv were calculated and rounded to the nearest 0.001 in the CIE 1931 chromaticity coordinates. The BYλ metameric locus was determined by identifying chromaticity bins with at least one positive and one negative BYλ value, as shown in Figure 3. The BYλ metameric locus was found to cut diagonally across the ANSI 3500 K chromaticity bin and include the entire Planckian locus from 3200 K to 3700 K. In order to avoid the possibility of BYλ metameric lighting scenarios in accordance with the CS model, luminaires with chromaticities that correspond to the 3500 K bin should be avoided.
While identification of the BYλ metameric locus is important it is not by itself sufficient to provide confidence for BYλ mechanism for a chosen environment will be stable over time or throughout the whole location of the environment. While Li et al. highlighted some potential issues with respect to the BYλ function of the CS model, other factors should also be considered. For example, chromaticity shift of luminaires is a well-known phenomenon [Davis 2016, Davis 2020, Bretschneider 2024]. It is especially of concern for LEDs, as the direction of shift can greatly vary between luminaires and even change over time for a specific luminaire in unpredictable ways [IES 2019]. Based on a survey of chromaticity shift limitations a consensus guard band of Δu’v’ = 0.004 is proposed for the BYλ metameric locus [Davis 2020, DL 2024].

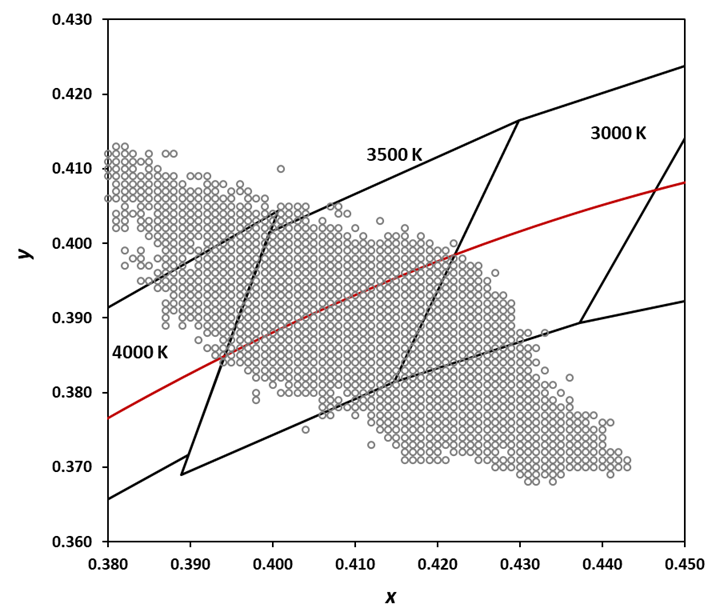
Figure 3: The metameric locus. Circles correspond to CIE chromaticity coordinates that can represent either blue-dominated or yellow-dominated spectra. The red line indicates the Planckian locus.
Inherent variability in the manufacturing process also means that a production run of LEDs demarcated by a single ANSI colour bin code may end up being mixed blue-dominant and yellow-dominant. Even LEDs with the same chromaticity coordinates may have different SPDs and thus result in a different sign for the BYλ function. A further complication of the manufacturing process is that luminaire SPDs are based integrating sphere measurements, and thus averages over all angles of the LED. In reality, SPDs emitted by LED vary by angle. Energy Star Specifications for Luminaires require that within the bean angle the chromaticity shall meet the requirement that of Δu’v’ ≤ 0.006 from the weighted average [ES 2016]. The environment also has an impact, as a significant portion of the light incident on the eye may be indirect reflected light. Factors like the colour of walls and ceiling will affect the SPD incident on the eyes, and may cause luminaires to straddle the metameric locus [Bellia 2017a]. Difference in wall colour within a standardised environment can significantly change the CCT of the light [Bellia 2017b]. When considering the impact of both chromaticity shift, as well as the impact on the luminaire SPD from angular variations in emissions and spectral reflectances of the environment, the guard band is expanded to Δu’v’ = 0.005.

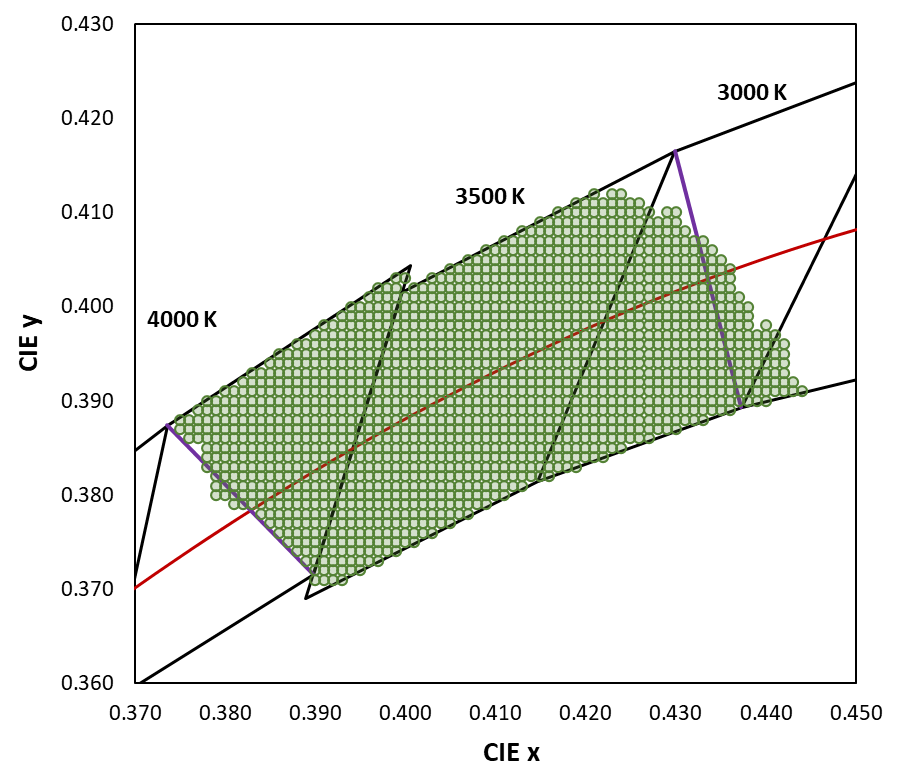
Figure 4: Expanded metameric locus accounting for spectral shifts in LEDs due to aging, angular differences in spectral emissions, and interactions with surfaces in the environment. The locus of chromaticity coordinates of concern can reasonably be approximated as residing between the upper left to lower right diagonals of the ANSI 4000 K and ANSI 3000 K chromaticity bins.
The primary BYλ metameric locus of the CS model has been identified as extending diagonally across the ANSI 3500 K bin and significant portions of the adjacent ANSI 4000 K and ANSI 3000 K bins. Additional factors that can affect the sign of the BYλ function have been identified. These include changes in SPDs for LEDS over time, angular variations in SPDs, and shifts due to reflectance of surfaces in the environment. Figure 4 shows the result when incorporating these uncertainties. The range of chromaticity coordinates of concern encompass almost the entire ANSI 3500 K chromaticity bin as well as half of the ANSI 3000 K and ANSI 4000 K bins. As a rule of thumb, the metameric locus is bounded by the diagonals of the 3000 K and 4000 K bins, as seen in Figure 4. if a luminaire falls anywhere within these diagonals, including the entire 3500 K bin, it is highly likely to be within the metameric locus. Within the limits of -0.0070 ≤ Duv ≤ 0.0070 the CCT values of concern include 2800 K ≤ CCT ≤ 4200 K.
This range of chromaticity coordinates represents a commonly used area in luminaires. Most warm white and neutral white LEDs fall within the 2800 – 4200 K range of CCT values, along with some cool white lights. This means a large amount of residential and commercial/retail lighting applications could be affected and exhibit unstable circadian effects when using predictions from the CS model due to changing signs in the BYλ function. These instabilities can cause significant differences in predicted nocturnal suppression, as well as differences up to a factor of two in the predicted CLA, meaning a potentially doubling in the energy requirements for the design. A tremendous difference of important to lighting designers. These differences can manifest both when considering seemingly similar luminaires, or when considering the naturally occurring differences in luminaires due to wear and tear or manufacturing variability. It is also noteworthy that this article does not present an exhaustive list of factors that can lead to variability in luminaires. If more factors are considered, the guard band may be expanded further, causing a larger range of luminaires to be at risk of unstable predictions.
References
Bretschneider 2025: Bretschneider E. Identification of the blue-yellow metameric locus of the circadian stimulus model. Lighting Research & Technology. 2025; 0(0)
Rea 2021: Rea MS, Nagare R, Figueiro MG. Erratum: Modeling circadian phototransduction: quantitative predictions of psychophysical data. Frontiers in Neuroscience 2021; 16: 849800
Esposito 2022: Esposito T, Houser K. Correlated color temperature is not a suitable proxy for the biological potency of light. Scientific Reports 2022; 12: 20223
Li 2022: Li S, Zhao X, Tao Z, et al. A simplified computational model for circadian stimulus based on illuminance, correlated color temperature, and color rendering index. IEEE Photonics Journal 2022; 14: 1–10
IES 2019: Illuminating Engineering Society. Technical Memorandum: Projecting Long-Term Chromaticity Coordinate Shift of LED Packages, Arrays, and Modules. ANSI/IES TM-35-19+E1. New York, NY: IES, 2019
Davis 2016: Davis L, Young J, Royer M. CALiPER 20.5: Chromaticity Shift Modes of LED PAR38 Lamps Operated in Steady-State Conditions. U.S. Department of Energy, 2016
Davis 2020: Davis L, Hansen M. Lumen and Chromaticity Maintenance Behavior of Light-Emitting Diode (LED) Packages Based on LM-80 Data. Morgantown, WV: U.S. Department of Energy, 2020
Bretschneider 2024: Bretschneider E. Can designs and measurements based on the circadian stimulus model stand the test of time? All Things Lighting Association. Retrieved 1 May 2025 from
https://www.allthingslighting.org/can-designs-and-measurements-based-on-the-circadian-stimulus-model-stand-the-test-of-time/
DL 2024: DesignLights. Technical requirements v5.1. Retrieved 30 April 2025 from https://designlights.org/our-work/solid-state-lighting/technical-requirements/ssl-v5-1
Bellia 2017a Bellia L, Pedace A, Barbato G. Daylighting offices: a first step toward an analysis of photobiological effects for design practice purposes. Building and Environment 2017; 74: 54–64
Bellia 2017b Bellia L, Pedace A, Fragliasso F. Indoor lighting quality: effects of different wall colours. Lighting Research and Technology 2017; 49: 33–48
ES 2016 ENERGY STAR. ENERGY STAR program requirements for luminaires. Retrieved 1 May 2025 from https://www.energystar.gov/sites/default/files/Luminaires%20V2.2%20Final%20Specification_0.pdf
0 Comments