
Ian Ashdown, P. Eng., FIES, Senior Scientist, SunTracker Technologies Ltd.
Published: 2016/02/17
Blue-rich light from LED streetlights, we are told, is the nemesis of professional and amateur astronomers. Blue light is preferentially scattered by the atmosphere, resulting in potentially unacceptable levels of light pollution for astronomical observations. Unfortunately, LED streetlights emit more blue light on a per-lumen basis than the high-pressure sodium streetlights they are rapidly replacing.
Botanists and horticulturalists, however, may choose to differ. For them, it is red light from streetlights that is the problem. Depending on the species and various environmental factors, even low levels of light trespass from roadway and outdoor area luminaires can have harmful effects on both wild and domesticated plants. LED streetlights likewise emit more red light on a per-lumen basis than high-pressure sodium streetlights.
This is not a newly discovered problem. Botanists were aware of the deleterious effects of incandescent street lighting on trees eighty years ago (Matske 1936), while horticulturalists became aware of the problem with respect to ornamental plants some forty years ago (Cathey and Campbell 1975).
The lighting community can perhaps be excused for not following the latest research in publications such as American Journal of Botany and Journal of Arboriculture, but we were in fact made aware of the issue through publication of an article in Lighting Design and Application (Cathey and Campbell 1974). However, given that the proposed solution then was to avoid using high-pressure sodium (HPS) lamps and instead use less-efficient mercury-vapor lamps with their ghoulish color rendering capabilities … well, we understandably ignored the advice.
Soybeans and Trees
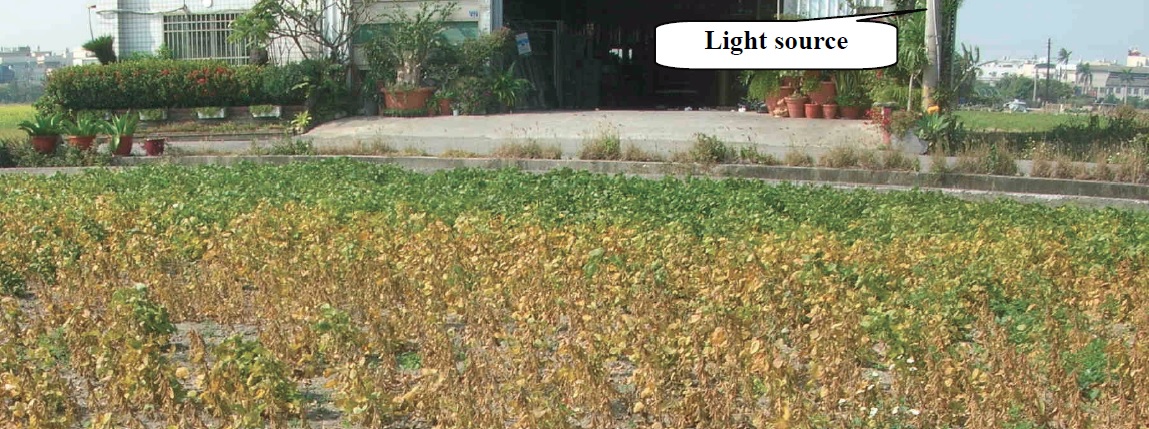
This is not to say that farmers are not aware of the problem. If you are growing soybeans, you quickly learn not to plant them in a field adjacent to HPS roadway lighting (FIG.1). The nighttime illumination — even as little as two to eight lux — can reduce crop yield by 20 to 40 percent due to delayed flowering and ripening (Chen et al. 2009).
Landscape designers and arborists are also aware of the problem. A publication from Purdue University, for example, lists 65 trees and shrubs that are vulnerable to artificial light (Chaney 2002). Exposure to nighttime illumination, particularly from HPS street lighting, may result in disruption of the plant’s shoot growth, flowering, leaf expansion and abscission, and bud dormancy. In temperate climates, this may make the plants more susceptible to frost, fungal infections, and insect infestations. Again, however, the advice was to avoid using HPS lighting and use mercury vapor lighting instead. For lighting designers, this is pointless advice — mercury vapor lamps were long ago replaced by high-pressure sodium lamps, and these in turn are being replaced by solid state lighting.
… and herein lies today’s issue. LED-based outdoor lighting may — and the emphasis is on the word may — exacerbate the problem from the perspective of wild and domesticated plants. High-pressure sodium lamps emit much more red light than mercury vapor lamps on a per-lumen basis, and white light LEDs may (depending on their correlated color temperature) emit even more. What was once a minor problem for landscape designers and urban arborists may become something that lighting designers will need to consider.
To better understand this issue, we first need to understand the role of photopigments in plant growth and development.
Phytochrome
Plants perform their magic of photosynthesis using a photopigment called chlorophyll, but this is only one of many different photopigments plants use to harvest and detect light. Equally important is phytochrome, which regulates a long list of plant functions, including:
- Seed germination and development
- Stem elongation
- Leaf expansion and abscission
- Photosynthesis development
- Flowering
- Ripening
- Dormancy
Taken together, these functions basically outline the life cycle from seed to adult plant.
The sum of these light-induced changes is called photomorphogenesis. There are other photopigments involved, including blue light-sensitive cryptochromes (Lin 2002) and ultraviolet-sensitive UVR8 (Goto et al. 2006, Kami et al. 2010). However, it is phytochrome that dominates plant growth and development.
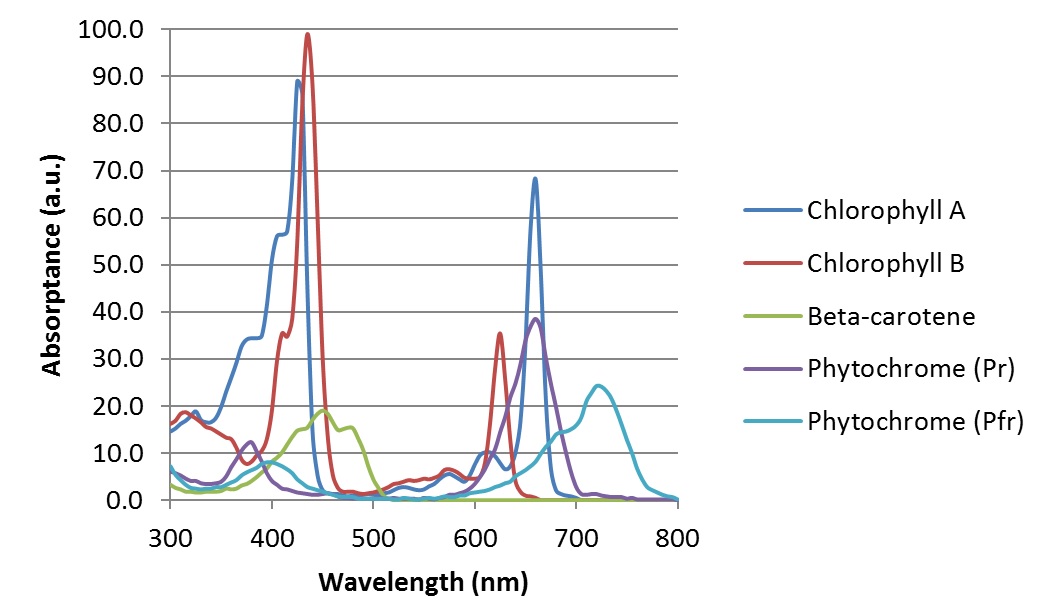
Phytochrome itself is an interesting pigment in that it has two states (or isoforms) called Pr and Pfr (e.g., Smith 2000). The Pr isoform strongly absorbs red light, with a spectral peak at about 660 nm (FIG. 2), making it look turquoise-blue when dissolved in solution. This is its biologically inactive state.
When a phytochrome molecule absorbs a red photon, it switches to its Pfr isoform, making it look slightly more greenish. This is its biologically active state, which signals to the plant that red light has been sensed. While in this state, phytochrome has a different spectral absorption distribution (FIG. 2), with a spectral peak at about 730 nm. (Horticulturalists and plant biologists refer to the spectral range of 700 nm to 800 nm as “far-red,” which explains the “fr” subscript.)
When the Pfr isoform absorbs a far-red photon, it reverts to its Pr isoform. Thus, phytochrome performs the function of a resettable biological switch to initiate or terminate photomorphological processes.

This biological switch behavior has some interesting consequences. While even low levels of red light can initiate many physiological responses, applying far-red light soon thereafter may reset the switch and terminate the response. Light pulses as short as one minute at night — think car headlights on a country road — are enough to induce or prevent the flowering of some plants (Borthwick et al. 1952). Worse, some plants have flower induction thresholds of less than four lux (Botto et al. 1996, Whitman et al. 1998).
Photoperiodism
Phytochrome may act as a biological switch, but how plants respond to its signaling varies by species and even cultivar. What all plants have in common, however, is photoperiodism, their physiological reaction to the length of the day. Like humans and all other animals, plants have circadian rhythms.
In terms of flowering, plants can generally be divided into three categories: 1) short day; 2) long day; and 3) day-neutral. For short day plants, flowering is initiated, advanced, or promoted when the dark nighttime period is sufficiently long to allow enough phytochrome Pfr to revert to Pr. For long day plants, the opposite is true: flowering is initiated, advanced, or promoted when the dark nighttime period is sufficiently short to increase nighttime levels of phytochrome Pr. As for day-neutral plants, their time of flowering is determined by other environmental cues, such as temperature and moisture.
From the perspective of wild and domesticated plants growing outdoors, artificial light can be a problem. For horticulturalists, however, it can be a boon. Florists have long used incandescent lamps with their copious red and infrared emissions to modify the growth and development of flowering plants in greenhouses. This promotes flowering in long day plants such as asters, azaleas, and fuchsias, while delaying flowering in short day plants such as chrysanthemums, begonias, and poinsettias.
The recent availability of high-power red and far-red LEDs has provided new opportunities for both florists and horticulturalists. Independently switching or dimming these LEDs enables greenhouse operators to precisely control phytochrome as a biological switch. This, combined with the secondary effects of activating cryptochromes using blue light, provides remarkable control of plant growth and development (e.g., Gautam et al. 2015, Islam et al. 2014, Kitazaki et al. 2015, and Lee et al. 2015).
Light Pollution
Outside of the greenhouse environment, however, adding red and far-red radiation to the environment is not a good thing. We can call it what it is: botanical light pollution. For soybean farmers and urban arborists, it may be a nuisance. However, there can also be more insidious and detrimental effects for wild plants and the pollinating insects that depend on them (e.g., Bennie et al. 2016).
The question is, how do we quantify this pollution? It is reasonably easy to quantify astronomical light pollution because we have comprehensive mathematical models of atmospheric physics and optics. However, the best that botanists can do for us is to identify plants as short day, long day, or day neutral.
Pragmatically speaking, we do not need to quantify botanical light pollution in an absolute sense of so many micromoles of radiation per square meter per second or whatever. From a lighting design perspective, the goal is to illuminate an area with so many lumens per square meter while doing our best to prevent wasted spill light. The question then becomes, what is the best light source for plants?
Comparing Light Sources
The phytochrome absorptance spectra (FIG. 2) were obtained by extracting phytochrome from plants and dissolving it in solution for analysis in vitro with a spectrophotometer. When in the plant itself, however, phytochrome is surrounded by other photopigments, especially chlorophyll. Both chlorophyll A and chlorophyll B have absorptance spectra that overlap with those of the phytochrome isoforms (FIG. 3), so it is reasonable to ask whether this influences (or “screens”) the phytochrome absorptance spectra in vivo.
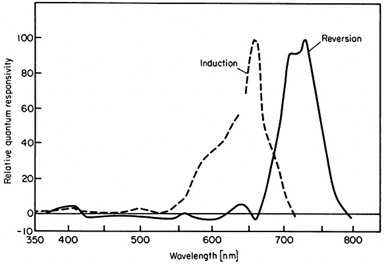
Fortunately, a variety of studies of the effect of monochromatic radiation on plant growth and development have shown that the absorptance spectra of phytochrome in vitro reasonably predict the plant physiological response. For example, Withrow et al. (1957) studied the “induction and reversion of hypocotyl hook opening” in bean seedlings. A plot of their results as induction and reversion “action spectra” shows a remarkable correlation with the in vitro absorptance spectra of phytochrome (FIG. 4).
Given this, we can use the phytochrome absorptance spectra as a species-independent measure of the effect of red and far-red radiation on plant growth and development (Sager et al. 1988). For a given light source, the probability of a phytochrome molecule absorbing a photon with a given wavelength is determined by the absorptance spectra of the isoform and the relative number of photons with that wavelength.
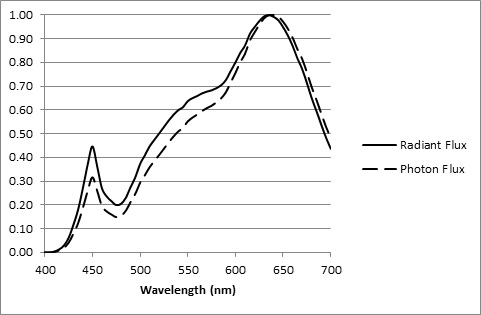
For a light source, we typically have its relative spectral power distribution (SPD), which is measured in watts per nanometer. However, from the Planck-Einstein relation, we know that a photon’s energy is inversely proportional to its wavelength. Therefore, to determine the relative spectral photon flux distribution, we need only multiply the lamp SPD by the wavelength for each wavelength and normalize the resultant graph. (An example is shown in FIG. 5.)
With this, we now have the means to compare light sources with different spectral power distributions. Given a reference lamp (say, HPS) and a test lamp (say, a 3000K warm white LED), the calculations consist of:
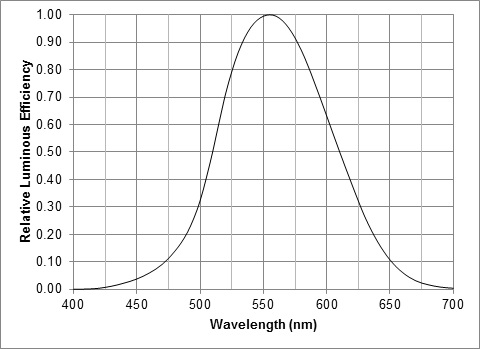
- Multiply the SPD values of each lamp by the CIE 1931 luminous efficiency function V(λ) shown in FIG. 6 from 400 nm to 700 nm.
- Sum the results of Step 1 to obtain the relative lumens Φref and Φtest generated by the two lamps.
- Multiply the SPD values of the test lamp by Φref / Φtest.
The two SPDs now represent the same number of photopic lumens (i.e., luminous flux) emitted by the lamps. With this:
- Multiply the SPD values of each lamp by the wavelength to obtain the lamp spectral photon flux distributions from 500 nm to 800 nm.
- Multiply the results of Step 4 by the phytochrome Pr spectral absorptance spectrum.
- Sum the results of Step 5 to obtain the Pr action values pAref,r and pAtest,r.
- Multiply the results of Step 4 by the phytochrome Pfr spectral absorptance spectrum.
- Sum the results of Step 7 to obtain the Pfr action values pAref,fr and pAtest,fr.
and finally:
- Add the Pr and Pfr action values for each lamp to obtain the lamp phytochrome action values pAref and pAtest.
- Divide pAtest by pAref to obtain the relative action value for the test lamp compared to the reference lamp.
A few explanatory notes:
- As shown in FIG. 2, the phytochrome absorptance spectra have secondary peaks in the near-ultraviolet. These are ignored because: a) it is difficult to disentangle the effects of phytochrome from the effects of the blue-sensitive cryptochrome photopigments; and 2) the photomorphological effects of blue light are less pronounced than those resulting from red and far-red radiation. The lower limit of 500 nm was chosen based on the phytochrome absorptance spectra minima.
- The spectral peak of Pfr is only 60 percent that of Pr, but the area under each spectral curve between 500 nm and 800 nm is almost the same. Also, phytochrome action spectra for various plant species have shown that equal red and far-red radiant fluences at the spectral peaks of 660 nm and 730 nm have approximately equal effect on the physiological responses. This justifies the final step of adding the two action values.
It must be emphasized that these “action values” are approximate at best, and should not be considered as formally quantifiable metrics. They are introduced here only to explore the potential effects of botanical light pollution.
With this caveat then, the following light sources were selected for comparison:
| Light Source | Manufacturer Product Code |
| High-pressure sodium (test) | Damar 1782 LU100M |
| 2700K white light LED | Lumileds LUXEON Rebel ES LXW9-PW27 |
| 3000K white light LED | Lumileds LUXEON Rebel ES LXW9-PW30 |
| 3500K white light LED | Lumileds LUXEON Rebel ES LXW8-PW35 |
| 4000K white light LED | Lumileds LUXEON Rebel ES LXH7-PW40 |
| 5000K white light LED | Lumileds LUXEON Rebel ES LXW8-PW40 |
Table 1 – Comparison light sources.
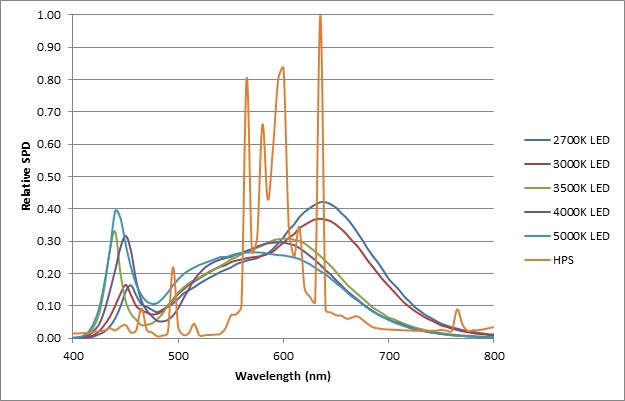
The HPS lamp SPD was measured in the laboratory with 0.1 nm resolution and averaged to 5 nm bins, while the Lumileds SPDs were digitized from the published datasheet (Lumileds 2014). The equal-lumen SPDs for these light sources are shown in FIG. 7.
Following the above calculation procedure with the HPS lamp as the test source, the relative phytochrome action values are:
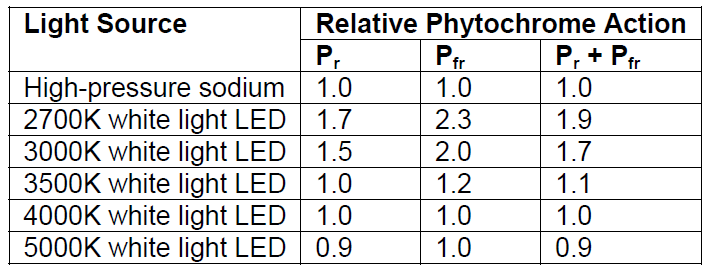
Table 2 – Relative phytochrome action values.
From this, it can be seen that while 2700K and 3000K white light LEDs produce the least astronomical light pollution (see related article Color Temperature and Outdoor Lighting), they also unfortunately produce the most botanical light pollution.
It should be noted however that these results apply to Lumileds LUXEON products only. Looking at FIG. 7, it is evident that the 2700K and 3000K products use a different phosphor formulation than the 3500K, 4000K, and 5000K products. Different major LED manufacturers will have their own proprietary phosphor formulations, and so the above results should not be applied to LEDs based solely on their nominal CCTs.
Add More Red
It seems counterintuitive, but one solution to the problem of excess red light generated by low-CCT LEDs is to add more red light.
Some of the early LED modules combined phosphor-coated white and red LED dice in order to compensate for the low-efficiency red phosphors then available. This produced a warm white light with good CIE Ra values, but relatively poor R9 values due to the quasimonochromatic red emissions.
One roadway luminaire manufacturer has recently taken this approach with a new product line that was reportedly designed to comply with the International Dark Sky Association’s Fixture Seal of Approval program requirements for a maximum CCT of 3000K. While the approach works (with a measured CCT of 3145K), the massive spike in red light peaking at 625 nm (see Fig. 8) would seem to be a botanist’s nightmare spectrum.

Surprisingly, the situation may not be as bad as it appears. First, there is relatively little far-red radiation being emitted. Second, the 625 nm peak occurs where the phytochrome Pr absorptance spectrum is only 50 percent of maximum. This results in a calculated phytochrome action value (relative to the HPS reference lamp) of 0.9 — half that of the 3000K LED.
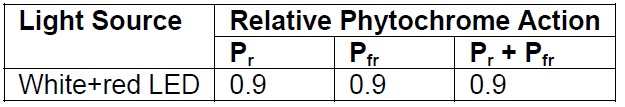
Table 3 – White+red relative phytochrome action values.
Color Filters
Another solution to the problem of excess red light is simply to add a color filter with a sharp cutoff at 625 nm. Red light beyond the cutoff wavelength contributes only ten percent to the luminous flux of a 3000K white light LED, so it is may be a reasonable tradeoff. (The resultant color will, however, be slightly cyan in hue.)
Whether it is possible to develop a suitable dye or coating for the LED optics that is both inexpensive and resistant to fading is, of course, an open question.
Chlorophyll Screening
The preceding analysis necessarily assumes that the phytochrome is not screened by the other plant photopigments, and that the isoform absorptance spectra represent the phytochrome action spectra for any given plant. In practice, this is not necessarily true. Phytochrome is present in very low concentrations in plant tissues. As a result, the much higher concentrations of chlorophyll tend to screen phytochrome by absorbing much of the incident red radiation. (See Fig. 3 for spectral overlapping between phytochrome Pr and chlorophyll A.)
A study by Beggs et al. (1980) demonstrated that if mustard seedlings are treated with the herbicide Norflurazon, the chlorophyll in the plant tissue becomes photobleached, resulting in white rather than green seedlings. With white seedlings, the phytochrome action spectrum had a peak at 660 nm, following the phytochrome Pr absorptance spectrum. With untreated green seedlings, however, the action spectrum was shifted to approximately 630 nm — which is well within the range of the 625 nm LED emission of the white+red LEDs (FIG. 9).

Summary
First and foremost, the phytochrome action metric presented in this article is not intended as a formal light source metric in any sense; it was introduced solely as a means of evaluating the potential impact of red and far-red light on both wild and domestic plants.
Second, the effects of applying red and/or far-red radiation will depend on the physiological state of the plant, the physiological response being mediated, and the time of application. Any excess (i.e., artificial) red radiation will convert the Pr isoform in the exposed plant to Pfr , while any excess far-red radiation will convert the Pfr isoform to Pr. Either action will upset the plantís phytochrome photostationary state (Sager et al. 1988). What effect this will have on a given plant species at any given time of the night and season is unknown.
While phytochrome may function as a biological switch for plants, how individual plants species respond to its signaling will vary. Given that phytochrome mediates so many plant functions, the botanist’s characterization of short day, long day, and day neutral flowering plants is probably about all they will have in common.
If the above analysis has shown anything, it is that by changing roadway and outdoor area lighting from high-pressure sodium to white light LEDs, we may — and again, the emphasis is on may — be upsetting the ecological balance in unexpected ways. By examining what we do know and applying it on a theoretical basis, we can at least be better prepared to respond in the future if we need to.
References
Beggs, C. J., M. G. Holmes, M. Jabben, and E. Schafer. 1980. “Action Spectra for the Inhibition of Hypocotyl Growth by Continuous Irradiation in Light and Dark-grown Sinapis alba L. Seedlings,” Plant Physiology 66:615-618.
Bennie, J. T. W. Davies, D. Cruse, and K. J. Gaston. 2016. “Ecological Effects of Artificial Light on Wild Plants,” Journal of Ecology (in press).
Borthwick, H.A., S. B. Hendricks, M. W. Parker, E. H. Toole, and V. K. Toole. 1952. “A Reversible Photoreaction Controlling Seed Germination,” Proceedings of the National Academy of Science 38:662-666.
Botto, J. F., R. A. Sanchez, G. C. Whitelam, and J. J. Casal. 1996. “Phytochrome A Mediates the Promotion of Seed Germination by Very Low Fluences of Light and Canopy Shade Light in Arasbidopsis,” Plant Physiology 110:439-444.
Cathey, H. M., and L. E. Campbell. 1974. “Lamps and Lighting — A Horticultural View,” Lighting Design and Application 4(11):41-52.
Cathey, H. M., and L. E. Campbell. 1975. “Security Lighting and its Impact on the Landscape,” Journal of Arboriculture 1(10):181-187.
Chaney, W. R. 2002. Does Night Lighting Harm Trees? Circular FNR-FAQ-17, Department of Forestry and Natural Resources, Purdue University.
Chen, C.-L., Y.-H. Su, C.-J. Liu, and Y.-C. Lee. 2009. “Effect of Night Illumination on Growth and Yield of Soybean,” Journal of Taiwan Agricultural Research 58(2):146-154.
Gautam, P., M. T. Terfa, J. E. Olsen, and S. Torre. 2015. “Red and Blue Light Effects on Morphology and Flowering of Petunia x hybrid,” Scientia Horticulturae 184:171-178.
Goto, N., T. Kumagai, and M. Koornneef. 2006. “Flowering Responses to Light-breaks in Photomorphogenic Mutants of Arabidopsis thaliana, a Long-day Plant,” Physiologia Plantarum 83(2):209-215.
Islam, M. A., D. Tarkowsk·, J. L. Clarke, D.-R. Blystad, H. R. Gislerod, S. Torre, and J. E. Olsen. 2014. “Impact of End-of-day Red and Far-red Light on Plant Morphology and Hormone Physiology of Poinsetta,” Scientia Horticulturae 174:77-86.
Kami, C., S. Lorrain, P. Hornitschek, and C. Fankhauser. 2010. “Light-regulated Plant Growth and Development,” Current Topics in Developmental Biology 91:29-66.
Kitazaki, K., S. Watanabe, A. Okamoto, M. Matsuo, S. Furuya, and K. Sameshima. 2015. “Far-red Light Enhances Removal of Pericarps in Tartary Buckwheat (Fagopyrum tataricum Gaertn.) Sprout Production under Artificial Lighting,” Scientia Horticulturae 185:167-174.
Lee, M.-J., S.-Y. Park, and M.-M. Oh. 2015. “Growth and Cell Division of Lettuce Plants under Various Ratios of Red to Far-red Light-emitting Diodes,” Horticulture, Environment, and Biotechnology 56(2):186-194.
Lin, C. 2002. “Blue Light Receptors and Signal Transduction,” The Plant Cell 14:S205-S225.
Lumileds. 2014. LUXEON Rebel ES Datasheet DS61 20140630.
Matzke, E. B. 1936. “The Effect of Street Lights in Delaying Leaf-fall in Certain Trees,” American Journal of Botany 23(6):446-452.
Sager, J. C., W. O. Smith, J. L. Edwards, and K. L. Cyr. 1988. “Photosynthetic Efficiency and Phytochrome Equilibria Determination Using Spectral Data,” Trans. ASAE 31(5):1882-1889.
Smith, H., Ed. 1977. The Molecular Biology of Plant Cells. Berkeley, CA: University of California Press.
Smith, H. 2000. “Phytochromes and Light Signal Perception by Plants — An Emerging Synthesis,” Nature 407:585-591.
Whitman, C.M., R. D. Heins, A. C. Cameron, and W. H. Carlson. 1998. “Lamp Type and Irradiance Level for Daylength Extensions Influence Flowering of Campanula carpatica ‘Blue Clips’, Coreopsis grandiflora ‘Early Sunrise’, and Coreopsis verticillata ‘Moonbeam’,” Journal of the American Society of Horticultural Science 123:802-807.
Withrow, R. B., W. H. Klein, and V. Elstad. 1957. “Action Spectra of Photomorphogenic Induction and its Photoinactivation,” Plant Physiology 32:453-462
[1] Plants in Action is a plant physiology textbook published by the Australian Society of Plant Scientists, New Zealand Society of Plant Biologists, and the New Zealand Institute of Agricultural and Horticultural Science. It is freely available online at http://plantsinaction.science.uq.edu.au.
0 Comments