
Ian Ashdown, P. Eng., FIES, Senior Scientist, SunTracker Technologies Ltd.
Published: 2016/03/03
UPDATE 2016/03/03 – Revised Figure 6.
The problem is astronomical — the blue light emitted by LED roadway luminaires has been shown to contribute to light pollution, especially when cool white LEDs are used. Blue light is preferentially scattered by air molecules, and so the higher the correlated color temperature (CCT), the greater the light pollution problem becomes. It is for this reason that the International Dark Sky Association requires a maximum CCT of 3000K for its Fixture Seal of Approval outdoor lighting certification program.
Sometimes, however, even warm white LED street lighting is not enough. For cities that are in close proximity to astronomical observatories, such as Flagstaff, AZ and the nearby US Naval Observatory Flagstaff Station, any amount of blue light is bad news.
Until recently, low-pressure sodium (LPS) street lighting has been the preferred choice. LPS luminaires are ideal light sources in that their monochromatic radiation (590 nm) is easily filtered out for astronomical observations. However, the large physical size of the lamps makes it difficult to control the luminous intensity distributions. For this and other reasons, municipalities are looking at “filtered LED” (FLED) street lighting as an option.
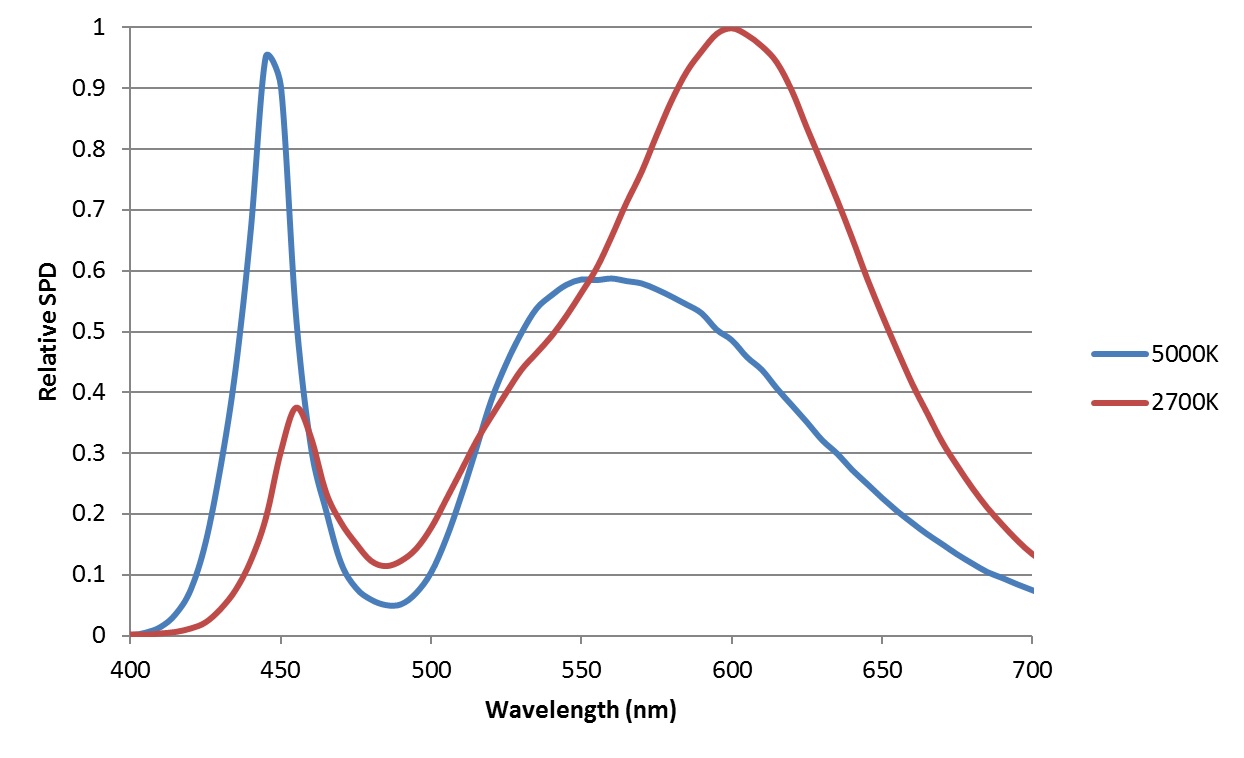
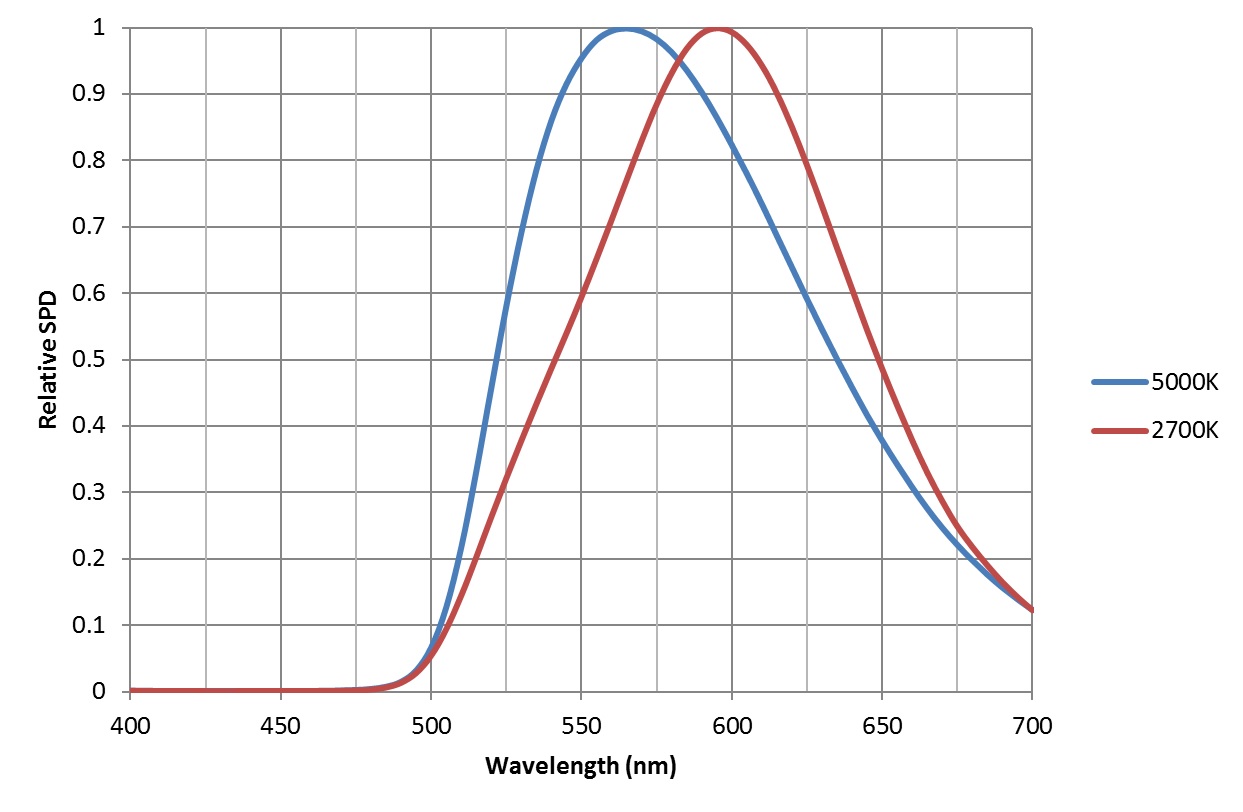
The reasoning is simple: combine a white light LED with a yellow filter and you can eliminate the blue peak that plagues astronomical observations. Figure 1, for example, shows the spectral power distributions (SPDs) of 2700K and 5000K white light LEDs with their characteristic blue peaks, while Figure 2 shows the SPDs of the same LEDs combined with yellow filters. The blue peaks have not been alleviated; they have been completely eliminated.
So, FLEDs are good for astronomical purposes, but what about lighting design?
Luminous Efficacy
At first glance, you might assume that filtering out the blue light will significantly reduce luminous efficacy. Perhaps surprisingly, this is not the case. Based on the SPDs shown in Figure 1 and Figure 2, the loss of luminous efficacy is less than ten percent for both warm white and cool white LEDs,
As a practical example, the SPDs shown in the above figures were taken from the photometric laboratory test reports of two commercial products from CW Energy Solutions. The salient data for these products are:

Table 1 – CW Energy Solution filtered LED roadway luminaire product specifications
To be clear, this is not an endorsement of these commercial products. This information is being provided for educational purposes only.
Chromaticity
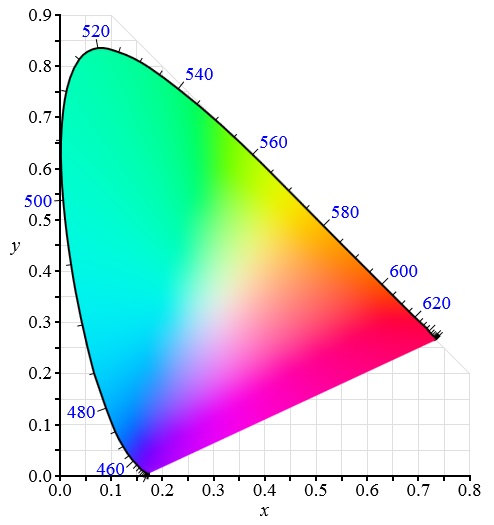
We can plot the chromaticity xy coordinates shown in Table 1 on a CIE 1931 chromaticity diagram (FIG. 3), but what do the actual colors look like? Unfortunately, most such diagrams reproduce the actual colors of the CIE 1931 color space very poorly. (Worse, it is impossible to display most saturated colors using the RGB color gamut of video displays.)
To answer this question, we can convert the xy chromaticity coordinates into CIE XYZ tristimulus values, and from there, assuming a video display with a 6500K white point, into RGB values for display. The chromaticity coordinates listed in Table 1 then appears much like these colors on a calibrated video display:


These are clearly not the sort of “white light” luminaires we would normally use for retail or residential lighting … but wait, there is more to this than meets the eye.
Color Rendering Capabilities
Looking again at Table 1, we see that the CIE General Colour Rendering Index Ra values for these products are frankly abysmal — 55 for the filtered 2700k (warm white) LEDs and 38 for the filtered 5000K (cool white) LEDs. The CIE Special Colour Rendering Index R9 values are even worse, with values of -56.5 and -81.9 respectively.
(As a reminder, a CRI value of 100 means that there is no perceptible color shifts with the eight CRI test color samples viewed under the test and reference lamps. It is quite possible, however, to have negative CRI values for the Special CRI values. Low-pressure sodium lamps, for example, have a CRI Ra values of -17.)
It is also interesting, and indeed useful, for lighting designers to understand why these perceived color shifts occur. Johann von Kries, a physiological psychologist who investigated chromatic adaptation in human color vision, noted in 1905 that we tend to see white objects as “white” regardless of the color temperature of the dominant light source. He postulated that our visual system adjusts the “gain” of the signals received from the red-. green- and blue-sensitive cones[1] in our retinae that are responsible for our color vision (von Kries 1905).
von Kries’ theory was formalized by the polymath Herbert Ives in 1912 as the von Kries transform, a mathematical operation that forms the basis of the calculation method for the CIE Colour Rendering Indices. While this psychophysiological “gain adjustment” works well (but not perfectly) in enabling us to perceive white surfaces under light sources with different CCTs (e.g., from 2800K incandescent lighting to 8000K overcast daylight), it tends to distort our perception of colored surfaces. (By way of analogy, think of adjusting the bass and treble controls on an audio system — particular settings may work for some music, but be unsuitable for other music.)
The beauty of the von Kries transform, however, is that it enables us to mathematically predict the color shifts due to a given test illuminant. Given a set of test colors — the Gretag-Macbeth ColorChecker is an obvious choice — we can predict and display what these colors will look like (e.g., Figure 5).
True — these color shifts are starkly evident, and would be completely unacceptable for retail and residential lighting. However, we need to remember that the topic of discussion is roadway lighting, specifically where municipalities are considering replacing high-pressure sodium (HPS) lamps with LED modules. With this, we need to look at the SPD of a typical HPS lamp (Figure 6).
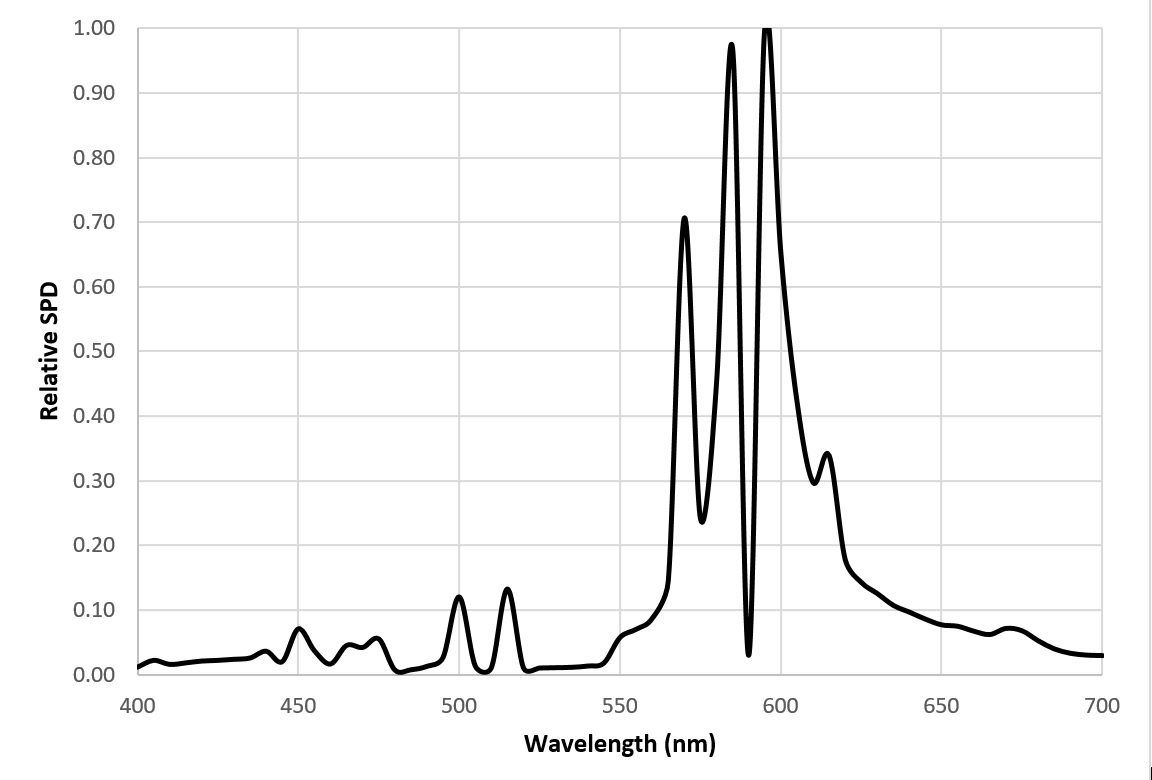
There are three points of interest here. First, the correlated color temperature (CCT) rating of 2100K is nominal — the CIE 1931 xy chromaticity coordinates of this lamp are not particularly close to the blackbody locus, and so by definition the CCT rating is technically meaningless (CIE 2004).
Second, HPS lamps have a CRI Ra value of 24 — worse than filtered LEDs.
Third – and this is the key point — most municipalities have been using HPS street lighting ever since it replaced the mostly unlamented mercury vapor street lighting in the 1980s. After thirty years of use, most residents have known nothing but their orange-yellow glow.
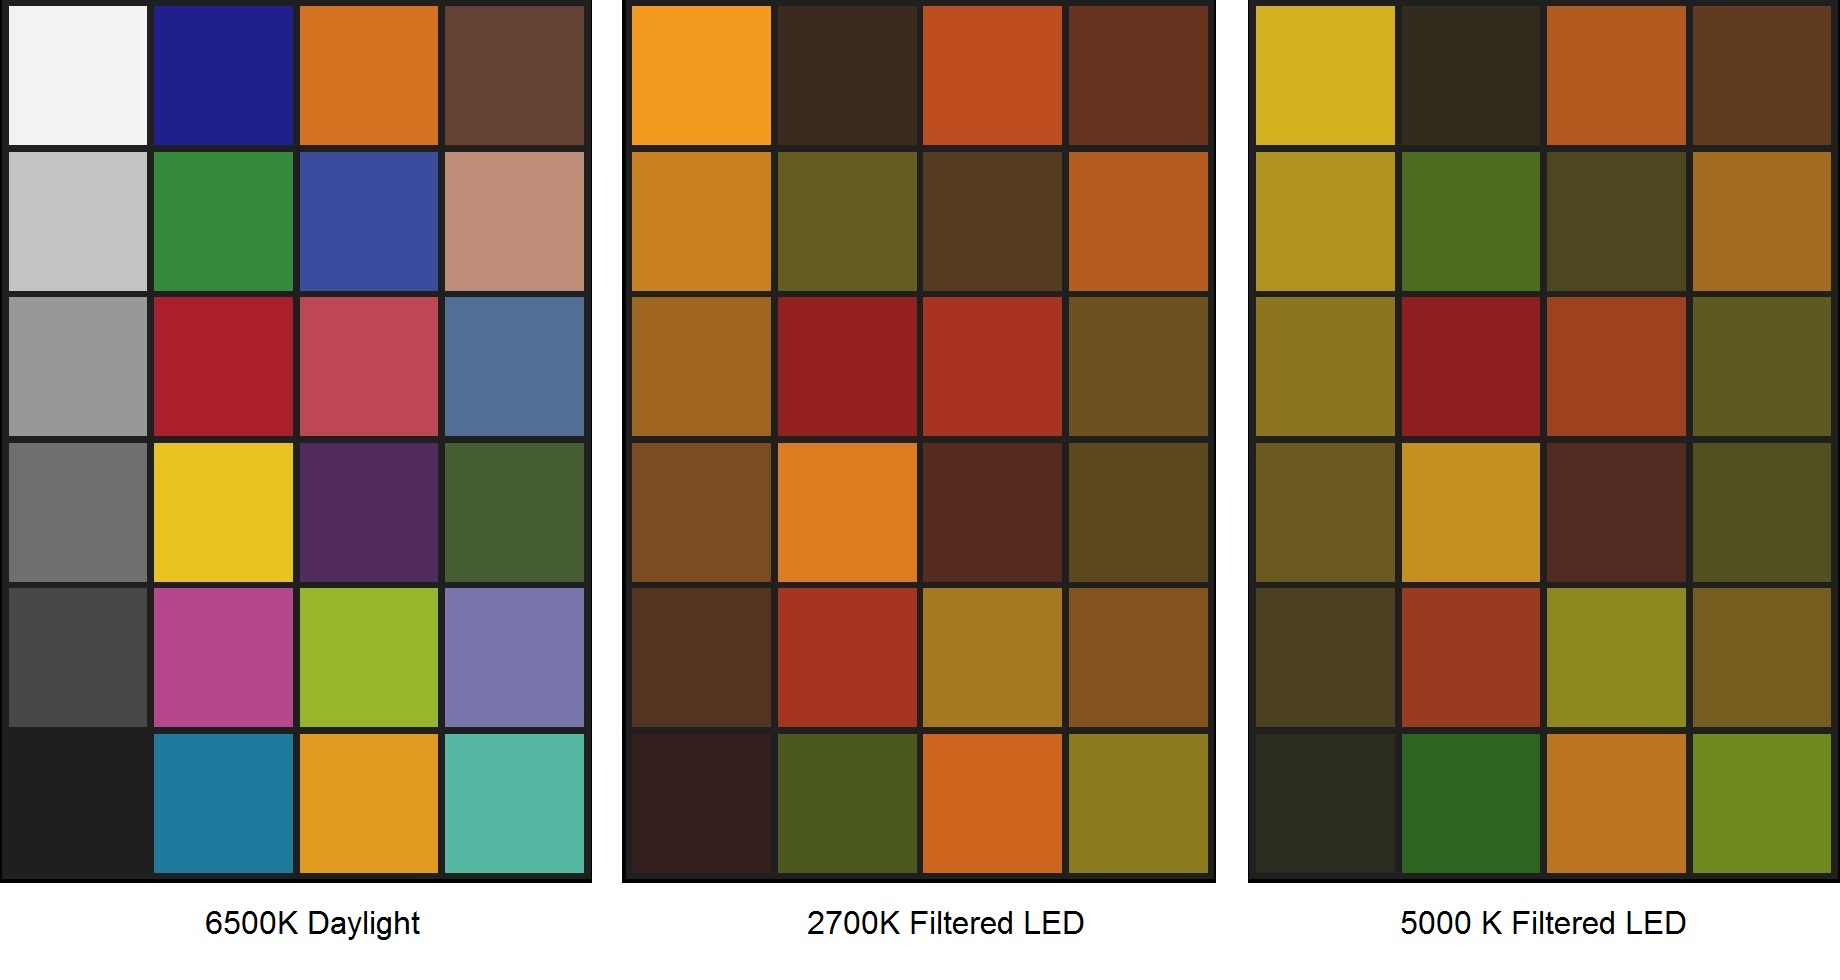
Putting aside the roadway luminaire manufacturers’ arguments that most people prefer “white” light, it is instructive to visualize the color rendering capabilities of filtered LEDs versus HPS lamps (FIG. 7).
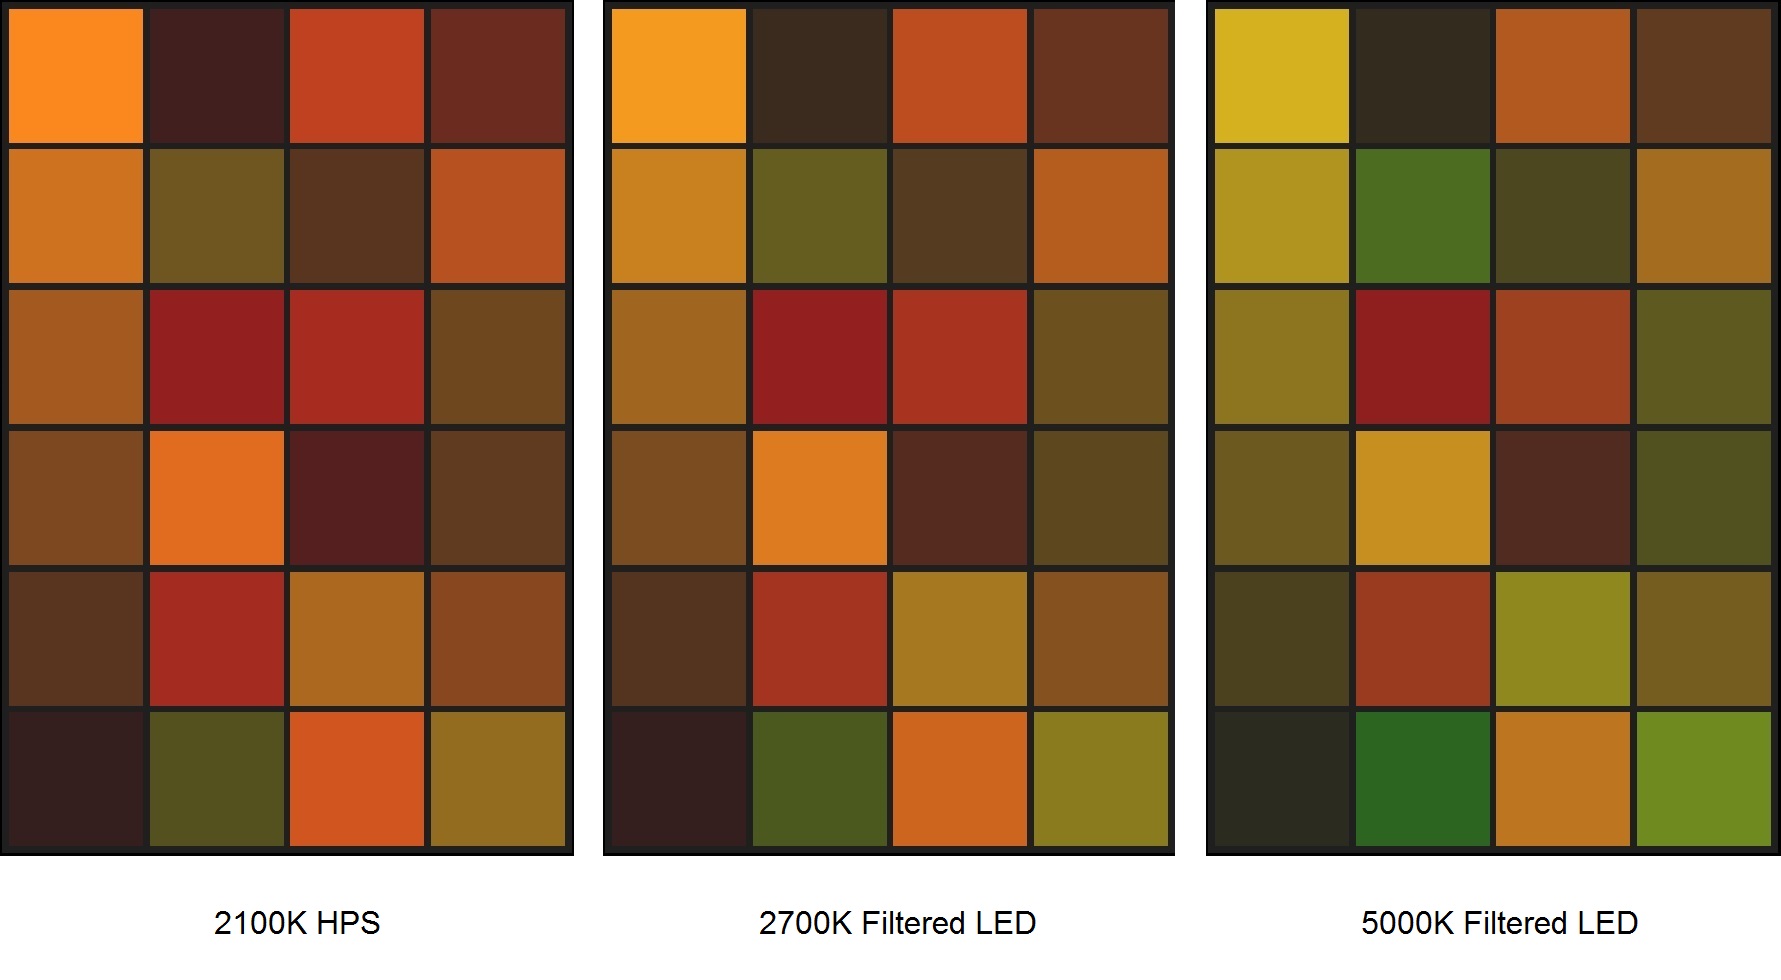
What is there to say, other than “oh …”? The point is that color rendering under filtered LED illumination is no worse, and arguably somewhat better, than under today’s prevalent HPS roadway illumination. It is not the color of the roadway luminaires that is important; it is the perceived colors of the objects that they illuminate.
The deciding factor for most municipalities will likely be whether residents like, dislike, or are simply neutral regarding the color rendering capabilities of filtered LED roadway lighting. In many cases, a test installation will likely be needed. Before then, however, it is important not to dismiss filtered LEDs simply because they are not “white light.” Furthermore, it is equally important not to compare them with white light LEDs solely on the basis of their CCT, CRI, or chromaticity values.
Conclusions
The purpose of this article is not to promote filtered LEDs as an alternative to low-pressure sodium lamps, or even as a preferred solution to light pollution problems. Rather, it is an attempt to take the various metrics describing the color rendering qualities of filtered LEDs and visualize them.
How lighting designers, roadway luminaire manufacturers, municipal engineers, and community activists choose to use this information is beyond the scope of this article. All that needs to be said is, “a picture is worth a thousand words.”
Acknowledgements
Thanks to Bob Adams of CW Energy Solutions and Tim Robinson of Esterline Corporation for providing the product technical information used in this article.
Thanks to George Livadaras for reporting an error in Figure 6.
References
CIE. 1995. CIE 13.3-1995, Method of Measuring and Specifying Colour Rendering Properties of Light Sources. Vienna, Austria: CIE Central Bureau.
CIE. 2004. CIE 15:2004, Colorimetry, Thirds Edition. Vienna, Austria: CIE Central Bureau.
von Kries, J. 1905. Die Gesichtsempfindungen. Handbuch der Physiologie der Menschen.
[1] These are technically referred to as long-, medium-, and short-wavelength, or LMS, retinal cones.
0 Comments