
Ian Ashdown, P. Eng., FIES, Senior Scientist, SunTracker Technologies Ltd.
Published: 2014/06/25
We most often think of lighting design in terms of lumens, color temperature, and CRI, but there are occasional situations where a deeper analysis is required. One such situation is as close as your doctor’s office: the examination room.
An examination room is typically windowless and illuminated only by linear fluorescent lamps. In examining the patient’s skin for anything from bruises to lesions, the doctor relies on experience to assess skin color. Anything that influences this perceived color should be a concern, for it could potentially lead to a misdiagnosis.
As lighting designers, our usual criterion for selecting light sources is the CIE General Colour Rendering Index (CRI) metric (CIE 1995). Anyone who remembers the first generation of white light LED products will recognize that CIE Special Colour Rendering Index R9 is also important, as it determines the red content needed for acceptable skin tones.
This however may not be enough for applications involving medical diagnosis. It is an interesting exercise to ask what determines our skin color and whether different illuminants might lead to unexpected changes in perceived color.
Skin Color
Skin color shows large variations across continental populations, but it is mostly due to the concentration of two biopolymers: eumelanin and pheomelanin (e.g., Parra 2007). Eumelanin is dark brown to black in color, while pheomelanin is yellow to reddish brown. Our skin produces melanin in response to exposure to ultraviolet radiation, causing the skin to visibly tan. (Melanin is a highly effective natural sunscreen.)
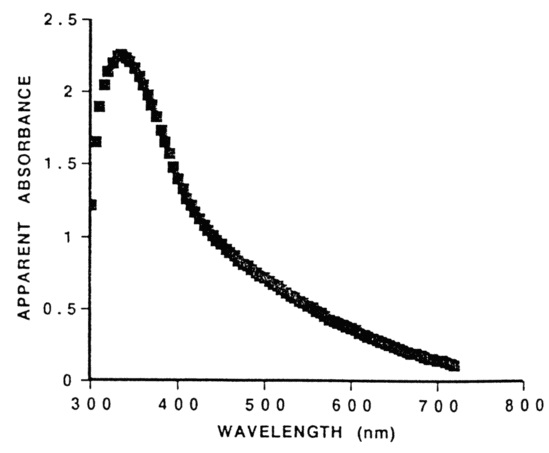
By itself, melanin is not particularly interesting from a lighting design perspective. As shown in FIG. 1, it has a smooth spectral absorption spectrum that increases monotonically with decreasing wavelength. Changes in the spectral power distribution of the light source will have little effect on perceived color as long as the light sources have the same correlated color temperature (CCT) and similar CRI values.
A secondary but still important determinant of skin color is the hemoglobin in our blood. It is responsible for example for the reddish color of sunburnt skin, as well as the inflammation that accompanies many skin infections. Its presence becomes more noticeable in fair-skinned individuals.
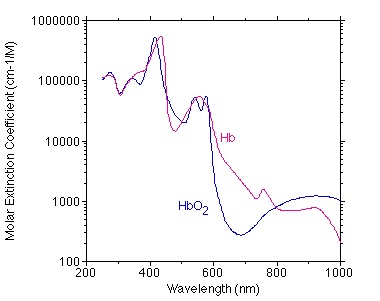
There are two types of hemoglobin in our blood — oxygenated (designated HbO2) and deoxygenated (designated Hb). Unlike melanin, they have rather complex spectral absorption spectra, as shown in FIG. 2.
The contributions of both melanin and hemoglobin are evident in FIG. 3, which shows the variation in spectral reflectance of the inner upper arms (chosen to avoid suntan issues) of subjects from several different continental populations. Those with dark skin have smooth spectral reflectance distributions characteristic of melanin, while those with fair skin have complex spectral reflectance distributions due to the contribution of hemoglobin.

Hypothesis
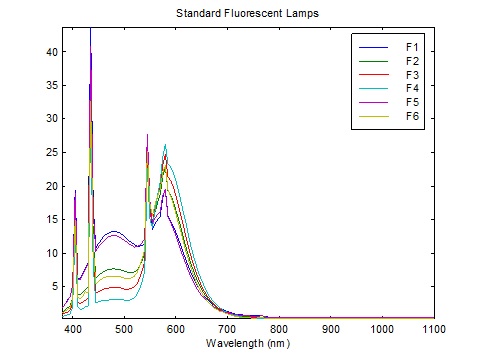
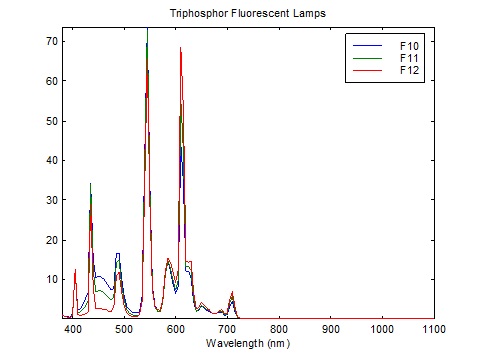
What is interesting about FIG. 3 is that Caucasian skin exhibits a pronounced dip in reflectance at 430 nm, presumably due to the absorption spectrum of both oxygenated and deoxygenated hemoglobin. This corresponds almost exactly with the narrowband emission of blue light from linear fluorescent lamps, which peaks at 435 nm as shown in FIGs. 4A – 4C.

By comparison, FIG. 5 shows the spectral power distribution of a typical white light phosphor-coated LED (in this case a Philips Luxeon K LED array). The phosphor pump LED has a peak wavelength of 450 nm.
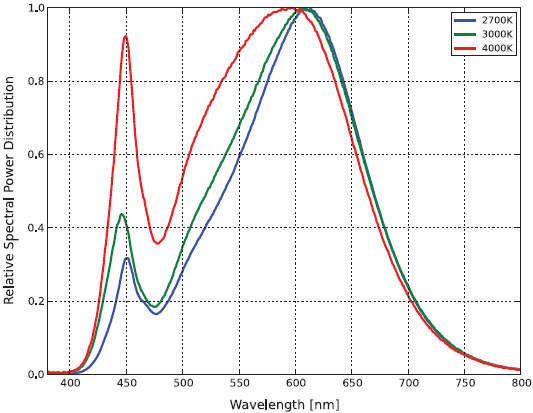
The hypothesis is this: even if an LED-based replacement lamp for a linear fluorescent lamp has the same CCT and similar CRI, the LED peak wavelength is not centered on the absorption peak of hemoglobin. As shown in FIG. 3, Caucasian skin reflectance at 450 nm can be some 25 percent greater than at 430 nm. Certainly increasing the amount of blue light from an RGB luminaire by 25 percent changes the color of the emitted light. The question is whether this will change the perceived skin color for medical diagnosis.
The issue is complicated by the finite width of the emitted blue light in the blue region of the spectrum. The LED has a full width half maximum (FWHM) value of 35 nm, while the fluorescent lamps appear to have FWHM values of less than 10nm. (The CIE lamp spectra are tabulated in units of 5 nm.)
The best way to test this hypothesis then is to calculate the theoretical perceived skin color (technically its chromaticity) using the lamp spectra and the worst-case skin (Caucasian) spectral reflectance distribution.
Calculation Method
The calculation method is quite simple. We have the fluorescent lamp spectra tabulated at 5 nm, courtesy of Table T.6, “Relative spectral power distributions of illuminants representing typical fluorescent lamps,” from CIE 15:2004, Colorimetry (CIE 2004), over the range of 400 to 700 nm. To ensure comparable CCTs, we choose CIE F6 (4150 K), CIE F9 (4150K), and CIE F11 (4000K).
Philips does not provide tabulated spectral power distribution data for their Luxeon products, but it is easy enough to digitize the data using for example the freeware program Plot Digitizer (http://plotdigitizer.sourceforge.net). Again, the 4000K product is selected.
Finally, the skin reflectance data can be digitized from the PDF file of the paper by Parra (2007).
With this, the CIE 1931 tristimulus coordinates X, Y, Z for each light source can be calculated as the sums:
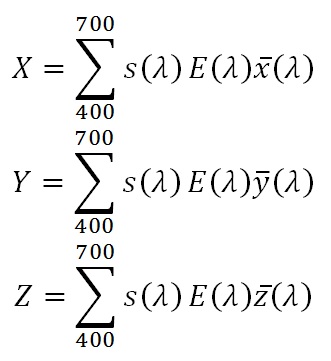
where s is the skin reflectance at the designated wavelength, E is the relative light source intensity, and x-bar, y-bar, and z-bar are the CIE color matching function values (from CIE 2004). From these, we can calculate the CIE 1931 xy chromaticity values as:

If we choose the CIE F11 triphosphor lamp as our reference illuminant, this gives us:
| Light Source | CCT | x | y | dx | dy | JND |
| F6 | 4150K | 0.395 | 0.398 | -0.009 | +0.011 | 2 |
| F9 | 4150K | 0.393 | 0.383 | -0.011 | -0.004 | 1 |
| F11 | 4000K | 0.404 | 0.387 | +0.000 | 0.000 | 0 |
| Luxeon K | 4000K | 0.398 | 0.388 | -0.006 | +0.001 | 0 |
where JND represent one MacAdam ellipse (MacAdam 1942), or a “just noticeable difference” in perceived color under laboratory conditions from that of the reference lamp.
The halophosphate F6 fluorescent lamp results provide a useful sanity check. These 1970s-era lamps had very low red content and consequently CRIs in the low 70s. They tended to lend greenish color casts to Caucasian skin, which is shown by the two-MacAdam ellipse color shift towards green.
For modern triphosphor fluorescent lamps, however, we can see that there should be no perceptible color shift for normal skin color if they are replaced with white phosphor-coated LED products. In other words, the hypothesis is disproven.
Disclaimer
This analysis necessarily considers normal Caucasian skin color only, based on the published results of Parra [2007]. It does not consider the abnormal skin colors due to for example hypoxia (low oxygenated blood levels). Such conditions are most often diagnosed using quantitative techniques, such as pulse oximetry (which measures the relative difference in transmittance of Hb and HbO2 at visible and infrared wavelengths.) Research is also being conducted into whether “spectrally-tuned” light sources might increase the contrast of various skin conditions when viewed in visible light — see for example Litorja et al. (2007, 2009, and 2010), and Murai et al. (2012).
More important, this analysis has not been experimentally verified or peer-reviewed, and must not be taken as medical advice. If the question is asked, all that can be said is that, “theoretical analysis indicates that there should be no difference in the use of fluorescent versus LED-based replacement lamps for medical diagnosis of skin conditions.” If necessary, this analysis should be experimentally confirmed by a qualified physician who will be using the facility being designed.
Conclusion
It is interesting that this analysis has produced what is effectively a negative result. As such, it is unlikely that it would be accepted for publication by a peer-reviewed journal. Regardless, the result (subject to the disclaimer) itself is informative for lighting designers.
Taking a broader view, this analysis highlights the need for an industry standard for the electronic transfer of spectral data, much as IES LM-63-02 and EULUMDAT enable the electronic transfer of photometric data. It is frustrating and error-prone to have to manually digitize spectral data from scans of printed documents and screen captures of PDF files.
Fortunately, this situation is about to change. As of this writing, the IES Board has approved the publication of IES TM-27-14, IES Standard Format for the Electronic Transfer of Spectral Data. This document is scheduled for ANSI, and hopefully IEC, approval as an international standard. Once lamp and LED module manufacturers adopt this data format for their product specifications, studies such as this will become considerably easier to perform.
Acknowledgements
The topic of this blog posting arose from discussions with fellow members of the Human Centric Lighting Committee.
Update 2014/06/25
One of the joys of self-publishing through blogs is that you can post new information as it becomes available.
Cyanosis is the appearance of a blue or purplish discoloration of the skin due to the tissues near the skin surface having low oxygen saturation. I was aware of this medication condition while writing this article, but decided against discussing it on the advice of my family doctor, who had not seen a case of it in 25 years of family and sports medicine practice. If it is seen at all, it is likely in the emergency room, where pulse oximeters are usually available.
Regardless, there is a paper on the topic — “Lighting for Clinical Observation of Cyanosis” (Midolo and Sergeyeva [2007]) — and a government standard that lamps for hospital lighting in Australia and New Zealand must meet (AS/NZS [1997]) — the Cyanosis Observation Index (COI). There is also a now-outdated article on why older-style triphosphor lamps manufactured in the 1990s were not suitable for hospital lighting (LightLab [1997]).
Related to this is an interesting Philips white paper, “The Role of Lighting in Promoting Well-Being and Recovery within Healthcare” (Schlangen 2010). This 32-page publication on human-centric lighting for healthcare provides over 100 useful references to the literature.
References
AS/NZS. 1997. AS/NZS 1680.2.5:1997, Interior Lighting, Part 2.5: Hospital and Medical Tasks. Standards Australia.
CIE. 1995. CIE 13.3-1995, Method of Measuring and Specifying Colour Rendering Properties of Light Sources. Vienna, Austria: Commission Internationale de l’Eclairage.
CIE. 2004. CIE 15:2004, Colorimetry. Vienna, Austria: Commission Internationale de l’Eclairage.
Kollias, N. 1995. “The Spectroscopy of Human Melanin Pigmentation,” in L. Zeise et al., Eds., Melanin: Its Role in Human Photoprotection. Overland Park, KS: Valdenmar Publishing Company.
LightLab. 1997. Why Tri-Phosphor Lamps are Unsuitable for Hospital Lighting, Lab Notes Issue 4. Clontarf, Australia: LightLab International.
Litorja, M., S. W. Brown, M. E. Nadal, D. Allen, and A. Gorbach. 2007. “Development of Surgical Lighting for Enhanced Color Contrast,” Proc. Medical Imaging 2007, SPIE Vol. 61510K.
Litorja, M., S. W. Brown, C. Lin, and Y. Ohno. 2009. “Illuminants as Visualization Tool for Clinical Diagnostics and Surgery,” Proc. Advanced Biomedical and Clinical Diagnostic Systems VII, SPIE Vol. 71691B.
Litorja, M., and B. Ecker. 2010. “Use of a Spectrally Tunable Source to Explore Improvement in Chromatic Contrast for Illumination of Tissues,” Proc. Emerging Digital Micromirror Device Based Systems and Applications II, SPIE Vol. 759607.
MacAdam, D. L. 1942. “Visual Sensitivities to Color Differences in Daylight,” J. Optical Society of America 32(5):247-274.
Midolo, N. A., and L. Sergeyeva. 2007. “Lighting for Clinical Observation of Cyanosis,” The Australian Hospital Engineer 30(2):38-46.
Murai, K., H. Kawahiri, and H. Haneishi. 2012. “Improving Color Appearance of Organ in Surgery by Optimally Designed LED Illuminant,” Proc. World Congress on Medical Physics and Biomedical Engineering, IFMBE Proceedings 39:1010-1013.
Parra, E. J. 2007. “Human Pigmentation Variation: Evolution, Genetic Basis, and Implications for Public Health,” Yearbook of Physical Anthropology 50:85-105.
Philips. 2010. White Paper: The Role of Lighting in Promoting Well-Being and Recovery within Healthcare. Koninklijke Philips Electronics N.V.
Philips Lumileds. 2014. Luxeon K Datasheet DS102. Philips Lumileds Lighting Company.
Prahl, S. 1999. “Optical Absorption of Hemoglobin,” http://omlc.ogi.edu/spectra/hemoglobin.
Zijlstra, W. G., A. Buursma and O. W. van Assendelft. 2000. “Visible and Near Infrared Absorption Spectra of Human and Animal Haemoglobin,” Utrecht, Netherlands: VSP Publishing.
0 Comments