
Ian Ashdown, P. Eng., FIES, Senior Scientist, SunTracker Technologies Ltd.
Published: 2014/04/21
One of the joys of statistics is that you can never be proven wrong …
In a previous All Things Lighting article titled “Understanding Mesopic Photometry” (October 8th, 2013), I wrote:
Some publications on mesopic lighting have indicated that the S/P ratio of a lamp can be estimated from its correlated color temperature (CCT), but this is incorrect …
I continued on with an example that compared the spectral power distributions and scotopic-to-photopic (S/P) ratios of a phosphor-coated white light LED:
and a red-green-blue LED:

Both lamp modules had the same correlated color temperature (CCT) of 3500K, but their S/P ratios were 1.41 and 2.02 respectively. I concluded that:
Simply put, the only way to accurately determine the S/P ratio of a light source is through calculation using its spectral power distribution.
While this statement is technically correct, it is not particularly useful when you need to know the S/P ratio of a lamp or lamp module for mesopic roadway or area lighting calculations.
Measurements and Equations
One of the publications I chose not to reference was the “City of San Jose Public Streetlight Design Guide” [Anon. 2011]. This report presented a list of eight light sources with their reported S/P ratios, which were derived from [CIE 2010] and [Berman 1992]:
| Source | S/P Ratio | CCT |
| Low pressure sodium | 0.25 | 1700 |
| High pressure sodium | 0.65 | 2100 |
| Warm white metal halide | 1.35 | 3500 |
| Daylight metal halide | 2.45 | 5500 |
| Warm white fluorescent | 1.00 | 3000 |
| Cool white fluorescent | 1.46 | 3700 |
| Triphosphor fluorescent | 1.54 | 4100 |
| Daylight fluorescent | 2.22 | 7500 |
Table 1 – S/P Ratio versus CCT [Anon. 2011]
This list is somewhat selective, as Berman reported the S/P ratio versus CCT of sixteen light sources:
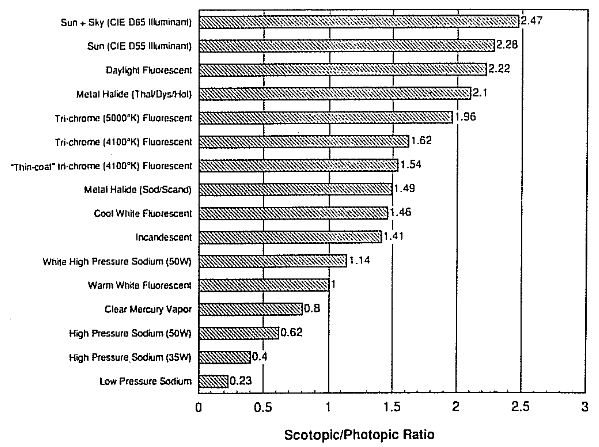
The report noted:
Although the S/P ratio is derived from the spectral power distribution of the light source, it approximately corresponds to the correlated color temperature of that source.
However, this was immediately followed by:
To determine the S/P ratio for any given CCT, the following equation can be used:
S/P ratio = -7 * 10-8 (CCT)2 + 0.001 * CCT ñ 1.3152
While I otherwise agree with the report, I must disagree with this statement. Of the tens of thousands of lamp types that are commercially available, you cannot fit a quadratic curve through a mere eight data points and generalize it to any light source. This is especially true when the light sources include the near-monochromatic spectral power distribution (SPD) of low-pressure sodium (LPS) lamps.
Worse, there is no indication of the expected error with this equation. You may calculate an S/P ratio for a given CCT, but you have no idea whether it is accurate. Is it for example 1.65, 1.6, or somewhere between 1.0 and 2.0?
Statistics
Based on the work of [Berman 1992], it is evident that the S/P ratio of a white light source “approximately corresponds” to its CCT. However, the evidence in support of this conclusion is statistically weak, and further does not consider today’s phosphor-coated white light LEDs.
What is needed is a random sampling of many commercial white light sources. Ideally, the work would be done by an independent photometric testing laboratory so as not to inadvertently skew the results towards the products of a single lamp manufacturer.
Having the results for many different light sources serves two purposes. First, it provides enough data points to have confidence that an equation fitted to the data fairly represents most commercial lamps and LED lamp modules.
Second, it provides the all-important confidence interval for any given S/P ratio. That is, given a calculated S/P ratio for a specific CCT, you can have (say) 95% confidence that the value is accurate to within a given range of values.
This is important because photometric measurements and calculations always include implicit confidence intervals. For example, electric lighting calculations are typically accurate to within ±10 percent when compared to careful in situ measurements of the completed project. It makes no sense therefore to perform (for example) mesopic roadway lighting calculations if your assumed S/P ratio varies by ±0.5.
Recommendations
The good news is that we now have the necessary information. LightLab International Inc. (www.lightlabint.com) recently collated the results of some 90 tests of LED-based roadway and area lighting luminaires that they performed for their customers. In accordance with the requirements of LM-79 testing procedures [IESNA 2008], the test reports included spectral power distribution measurements, and with them (although not required by LM-79) calculated S/P ratios.
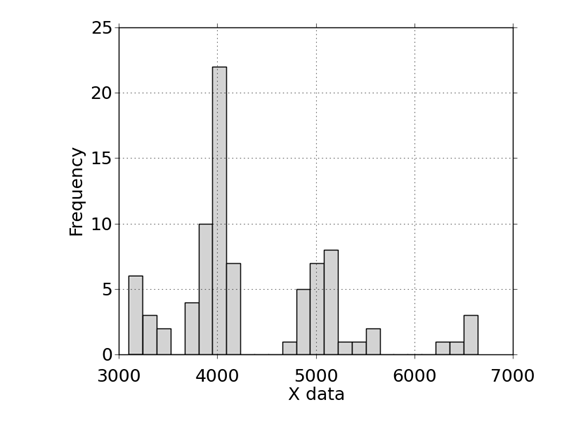
As you might expect, the lamp CCTs clustered around the industry-standard nominal values:
Perhaps less expected is that they exhibited a reasonably linear relationship between S/P ratio and CCT:
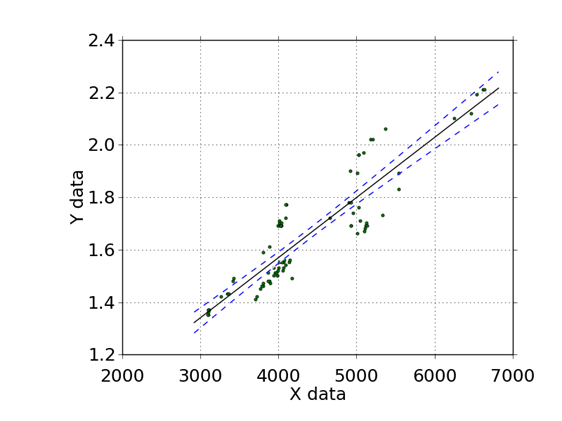
I will not repeat the curve-fitting equation here, as it has a meaningless precision of 15 decimal points. What is important is this table of recommended values (where the 2700K values were extrapolated from the measured data):
| CCT | S/P Ratio Range |
| 2700K | 1.1 – 1.4 |
| 3000K | 1.2 – 1.5 |
| 3500K | 1.3 – 1.6 |
| 4000K | 1.4 – 1.8 |
| 5000K | 1.6 – 2.0 |
| 6000K | 1.9 – 2.2 |
Table 2 – S/P Ratio versus CCT for LED lamps
Note carefully that this table applies to LED-based white light sources only; it does not apply to fluorescent (including magnetic induction) or HID lamps, and certainly not to LPS lamps. (Metal halide lamps in particular as reported in Table 1 are outside of the range of this table.)
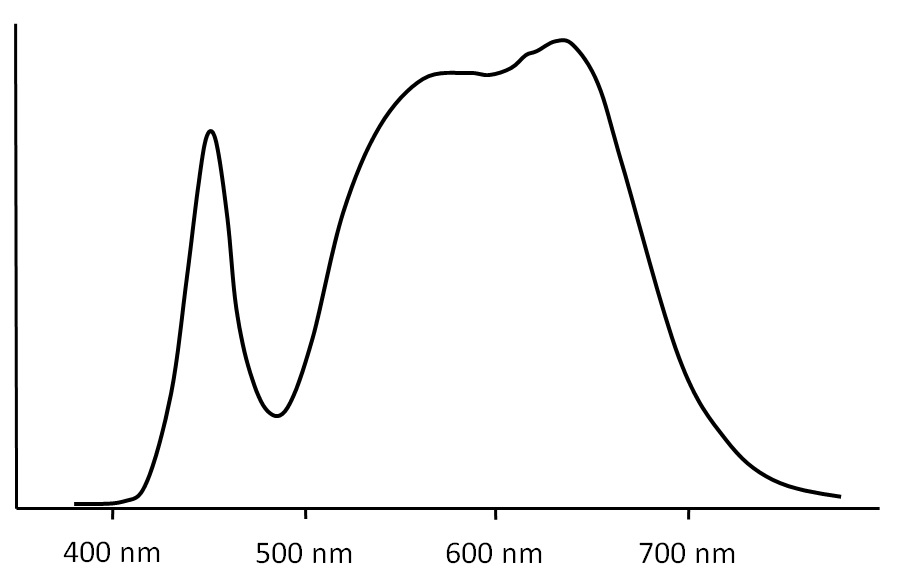
Looking at Figure 1, it is perhaps not surprising that LED lamps exhibit a strong correlation between S/P ratio and CCT. Virtually all of today’s high-flux LEDs for roadway lighting applications rely on a blue pump LED (which accounts for the 450 nm peak in Figure 1) and broadband emission phosphors between 500 and 700 nm. With minor differences due to different phosphor combinations, most white light LED SPDs will look something like Figure 1, with the CCT mostly determined by the ratio of the blue peak to the phosphor emissions.
The counterexample of course is the red-green-blue LED SPD shown in Figure 2, with its anomalous S/P ratio of 2.02 for a CCT of 3500K. It is not coincidental that the SPD somewhat resembles that of a triphosphor fluorescent or metal halide lamp.
Ideally, we would have S/P ratio versus CCT data for thousands of white light sources. It is unlikely that the recommended S/P values above would change by more than 0.1 units, but it would improve our statistical confidence in the results.
On the other hand, these results show that the S/P ratio varies by ±0.2 for any given CCT, or about ±10 percent of the median value. This is commensurate with the expected accuracy of most electric lighting applications.
Granted, it would be preferable to have S/P ratios available for every lighting product. (S/P ratios are also integral to IES TM-24-13, Incorporating Spectral Power Distribution into the IES Illuminance Determination System for Visual Task Categories P through Y [IESNA 2013].) As was explained in Understanding Mesopic Photometry however, there are practical reasons why this is unlikely to occur.
In retrospect, this likely does not matter. Lighting designers can rarely assume the use of particular product when performing photometric calculations. With competitive bidding for commercial and government projects, it is best to simply specify luminaires with a given CCT. Given that most new roadway and area lighting installations will involve LED-based luminaires, Table 2 provides lighting designers with the confidence that they can assume a usefully narrow range of S/P ratios for design and specification purposes.
References
Anonymous. 2011. City of San Jose Public Streetlight Design Guide. Available as www.sanjoseca.gov/DocumentCenter/Home/View/242.
Berman, S. W. 1992. “Energy Efficiency Consequences of Scotopic Sensitivity,” Journal of the IES 21(1):3-14.
CIE. 2010. Recommended System for Mesopic Photometry Based on Visual Performance. CIE Technical Report 191:2010. Vienna, Austria: Commission International de líEclairage.
IESNA. 2008. IES LM-79-08. Electrical and Photometric Measurements of Solid-State Lighting Products. New York, NY: Illuminating Engineering Society of North America.
IESNA. 2013. IES TM-24-13. Incorporating Spectral Power Distribution into the IES Illuminance Determination System for Visual Task Categories P through Y. New York, NY: Illuminating Engineering Society of North America.
Acknowledgements
Thanks to Eric Southgate of LightLab International Inc. (www.lightlabint.com) for sharing the S/P versus CCT data on which this article was based.
Thanks also to Dawn DeGrazio of Lighting Analysts Inc. for invaluable editorial assistance.
0 Comments