
Ian Ashdown, P. Eng., FIES, Senior Scientist, SunTracker Technologies Ltd.
Published: 2016/12/09
Horticultural lighting is currently one of the fastest-expanding markets in commercial lighting, with projected revenues of several billion dollars in less than a decade. From the perspective of a professional lighting designer, the market opportunities are enticing. Whether it is lighting for greenhouses or vertical farms and plant factories, the basic principles of lighting design remain the same.
There are, however, design metrics that will be unfamiliar to most lighting designers. One of these — the subject of this article — has the rather unwieldy name of phytochrome photostationary state (PSS). While rarely discussed outside of horticultural research publications, it represents an important concept for horticulturists, and particularly floriculturists.
To understand this metric, it is necessary to review some aspects of plant biology.
Photomorphogenesis
The development of plants, from seed to flowering, is very much dependent on the electromagnetic radiation they are exposed to. This developmental process, called photomorphogenesis, is completely separate from the process of photosynthesis. It relies on various photopigments, including phytochromes, cryptochromes, phototropins, and UVR8, to sense and respond to radiation ranging from ultraviolet to near-infrared.
Our interest is in the photopigment family of phytochromes, which are mostly sensitive to red and far-red visible radiation. They mediate the germination of seeds (photoblasty), the growth of stems and leaves toward visible light (etiolation), the time of flowering based on the length of day and night (photoperiodism), the synthesis of chlorophyll for photosynthesis, and more (e.g., Smith 2000). While there are six known members of the phytochrome family, it is convenient to refer to them generically and collectively as “phytochrome.”
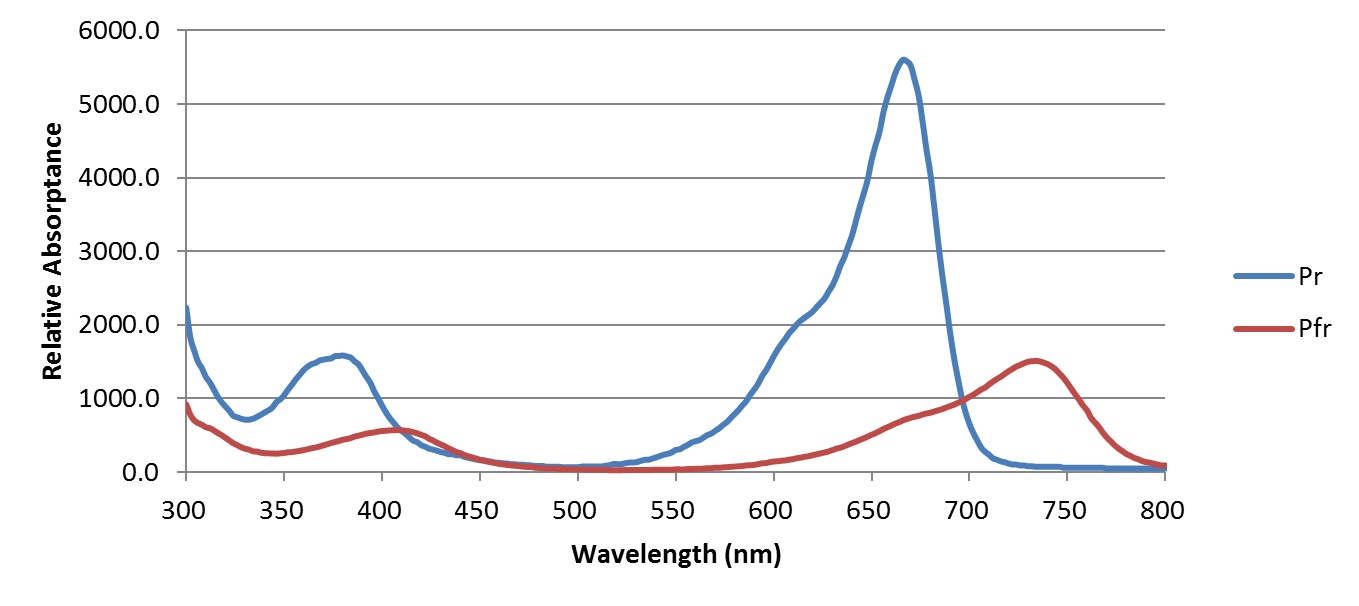
Phytochrome exists in two states, or isoforms. In its ground state (identified as Pr), phytochrome strongly absorbs red light, and so appears turquoise-blue in concentrated solution in vitro (Figure 2). When it absorbs a red photon, however, it changes its physical shape to form its physiologically active state Pfr. In doing so, its peak spectral absorptance shifts towards the far-red, with a concentrated solution of phytochrome appearing more greenish in color.
When phytochrome is in its Pfr state, it may absorb a far-red photon and change once again into its Pr state. This bistable behavior makes phytochrome an ideal biochemical switch, with the Pfr isoform serving as the ìsignalingî state to the plant. As one example of this biological function, red light typically penetrates several centimeters into loose soil (e.g., Borthwick et al. 1952, Botto et al. 1996). As the sun rises higher each day in the spring, an increasing amount of red light reaches the seeds, until a sufficient concentration of phytochrome switches from its Pr isoform to its Pfr isoform. This signals the cellular mechanisms of the seed that it is time to sprout. If, on the other hand, the seed is buried too deeply, it will never sprout and will eventually die.
Photoperiodism
The existence of phytochrome was first suspected nearly a century ago, when Garner and Allard (1920) studied the effects of day length on flowering plants. They observed that tobacco plants could be made to flower in summer by reducing the hours of daylight with artificial darkening, and that they could also be made to remain in a vegetative state during the winter by providing supplemental electric light. They called this effect photoperiodism.
Some plant species flower only when exposed to short periods of light (such as poinsettias — Islam et al. 2014), and so are called short-day plants, while others flower only after to exposure to long periods of light (such as spinach and radishes), and are called long-day plants. In some day-neutral plants (such as tomatoes), flowering is not regulated by photoperiod.
The reason for these reactions in both short-day and long-day plants is the response of phytochrome to red and far-red light. With short-day plants, exposure to a brief period of light during the night inhibits flowering, while the same exposure with long-day plants promotes flowering. Floriculturists can therefore use supplemental electric lighting to delay or advance the flowering of plants to meet market needs.
The traditional techniques for photoperiodic control include (Boyle 1992):
- Increasing the day length — While high-pressure sodium (HPS) lamps have traditionally been used for supplemental greenhouse lighting, incandescent lamps have the advantage of being rich in red and far-red radiation. Compact and linear fluorescent lamps have also been used, but their relative lack of red and far-red radiation makes them ineffective for phytochrome response manipulation.
- Night interruption — The phytochrome response to red and far-red radiation does not require continual exposure. Consequently, the flowering period can be influenced with only a few hours of electric lighting during the night. This has the advantage of being more energy-efficient.
- Cyclic (intermittent) lighting — If incandescent rather than HPS lamps are used, it may be sufficient to pulse the lighting with a short duty factor, such as one minute every half hour. (The optimal duty factor will depend on the irradiance at the plant canopy.)
- Shortening the day length — The plants are covered with an opaque material to reduce the irradiance, preferably to the equivalent of less than 20 lux of visible light. Typical materials are black sateen cloth, woven polyolefin sheeting, and black polyethylene films.
The problem with these techniques is that they are mostly trial-and-error with different plant species and greenhouse operation conditions. The goal is to manipulate the plant growth and development through the phytochrome response, but there is no practical means of quantitatively predicting the impact of these techniques.
Solid State Lighting
The introduction of solid state lighting to the horticultural industry has been nothing short of revolutionary. In addition to the energy savings afforded by the use of blue and red LEDs whose spectral power distributions (SPDs) are optimal for photosynthesis (Figure 1), the recent commercial availability of high-flux red and far-red LEDs from manufacturers such as Lumileds, Osram, and Cree means that horticulturists and floriculturists now have the ability to precisely tune the light source SPDs for optimal photoperiod control on a per-species basis.
While the LED manufacturers’ product names vary, the products of interest have peak spectral outputs at 660 nm and 730 nm, corresponding to the peak spectral absorptances of phytochrome isoforms Pr and Pfr, respectively (Figure 2). The key here is that the ratio of red to far-red light can be easily set or varied on a daily basis as required for photoperiodic control. Along with blue LEDs, this ability to precisely control the light source SPD leads to the promise of plant “light recipes,” where the SPD and other environmental factors can be chosen on a per-species basis, and possibly varied over the life cycle of the plant growth and development.
The problem, of course, is that in order to control something, you need to measure it. For professional lighting designers, you also need the ability to specify it.
PSS Metric
The phytochrome photostationary state (PSS) metric was introduced some two decades ago (Sager et al. 1998). It has been mostly of academic interest with HPS and incandescent lighting, but the introduction of LEDs for horticultural lighting has suddenly brought this metric to the forefront as a useful design tool.
The metric is conceptually simple: it is the ratio of the concentration of the Pr isoform of phytochrome to the total concentration of both isoforms:
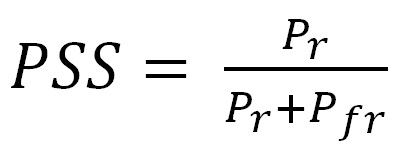
under constant irradiation by a light source. (The maximum value is less than unity because of the spectral overlap between the two isoforms.)
By itself, this seems of little to no interest to lighting designers — how do you measure the relative concentrations of the phytochrome isoforms in a plant? (It took nearly forty years from the time of Garner and Allard (1920) just to isolate phytochrome in the laboratory — Butler et al. 1959.)
What Sager and his fellow researchers did was to note that each phytochrome molecule could be conceptually modeled as an opaque sphere that fully absorbs any incident radiation. If you measure the spectral absorptance of the molecule in solution and know the concentration, you can calculate the equivalent photochemical cross-section of the molecule for each wavelength. (As an aside, LED manufacturers use exactly the same approach when modeling the optical characteristics of LED phosphors embedded in an epoxy or silicone matrix.)
With this, Sager et al. measured the spectral absorptance of the Pr and Pfr isoforms (reproduced in Figure 2) and expressed the results as phytochrome photochemical cross-sections, measured in square meters per mole (i.e., 6.022 x 10²³ molecules), represented as σr and σfr, respectively. Equation (1) then becomes:
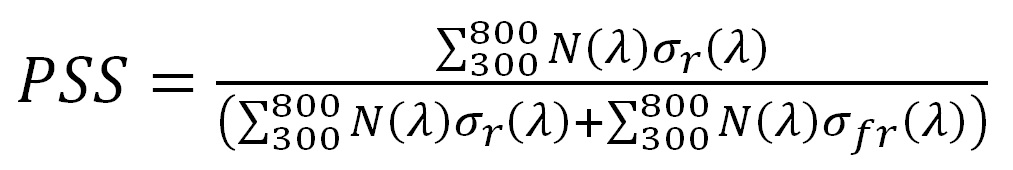
where N(λ) is the measured spectral photon flux for wavelength λ over the range of 300 nm to 800nm.
For photometric test laboratories characterizing horticultural luminaires, all that needs to be done is to measure the luminaire’s relative spectral power distribution. Calculating the PSS metric using the photochemical cross-section data from Sager et al. (1988) in accordance with Equation 2 is then a simple spreadsheet exercise.
For professional lighting designers, it is even simpler: the PSS metric is a direct indication of the ability of the horticultural luminaire to manipulate the phytochrome isoforms. While this will also depend, of course, on the absolute irradiance at the plant canopy, the PSS metric reduces the spectral power distributions of the red and far-red LEDs to a single number that can be specified.
LED Color Binning
We are not done yet! Professional lighting designers are all too familiar with the issue of precision in lighting design metrics. For example, lamp and luminaire manufacturers typically report the CIE General Colour Rendering Index (CRI) using two digits, such as CRI = 92. If you refer to the history of the CRI metricís development, however, you will learn that the intended precision of this metric is five units (van Trigt, 1999). In other words, the difference between CRI = 90 and CRI = 92 is visually imperceptible and so meaningless in terms of practical application.
The same question must be asked of the PSS metric. Is, for example, PSS = 0.39 quantitatively different from PSS = 0.38? Perhaps surprisingly, this is not a question for horticultural researchers. Rather, it is a question for lighting researchers and the lighting industry.
The underlying problem is a familiar one: LED color binning. Taking Lumiledís LUXEON SunPlus 20 series of horticultural LEDs as typical examples, we have:
| Product Name | Minimum Peak Wavelength | Maximum Peak Wavelength |
| Deep Red | 655 | 670 |
| Far Red | 720 | 750 |
Table 1 – LUXEON SunPlus 20 peak wavelength binning. (Source: Lumileds 2016).
The Lumileds product datasheet provides typical spectral power distributions for these two products with typical peak wavelengths, which can be digitized and shifted to represent the minimum, typical, and maximum peak wavelength SPDs, as shown in Figures 3 and 4. These figures also display the red Pr and far-red Pfr phytochrome spectral photochemical cross-sections (i.e., their spectral absorptances), with the SPDs normalized to the peak cross-sections for display purposes only.
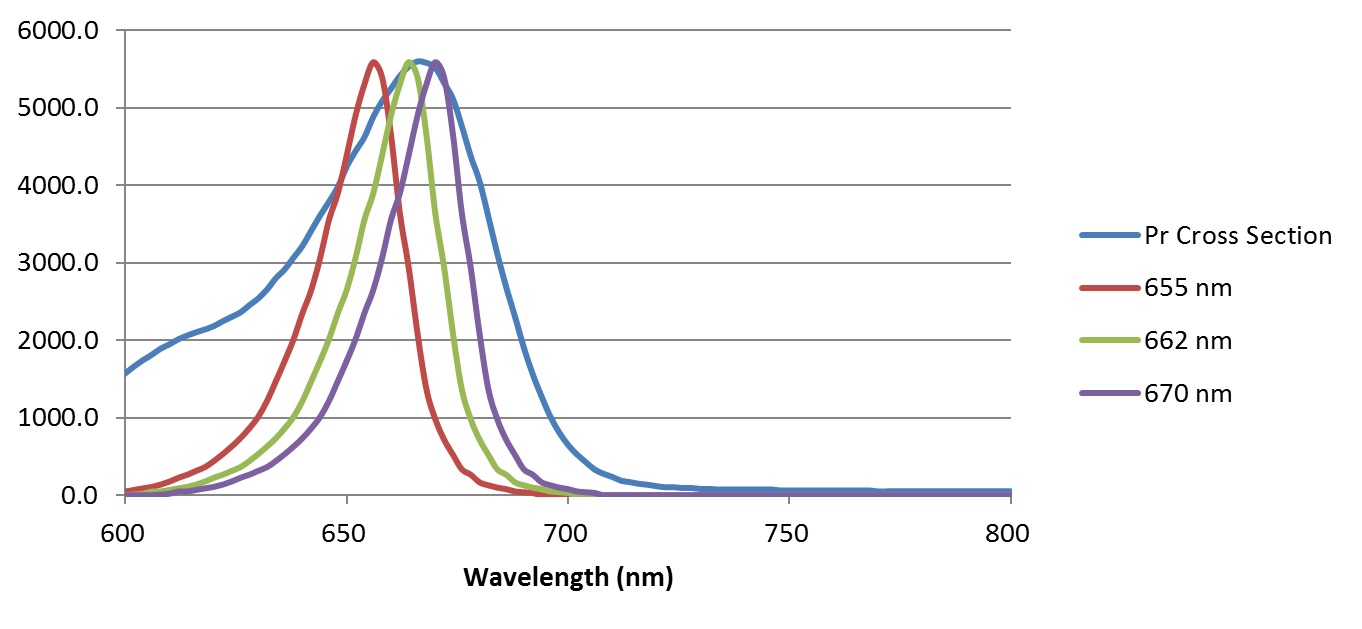
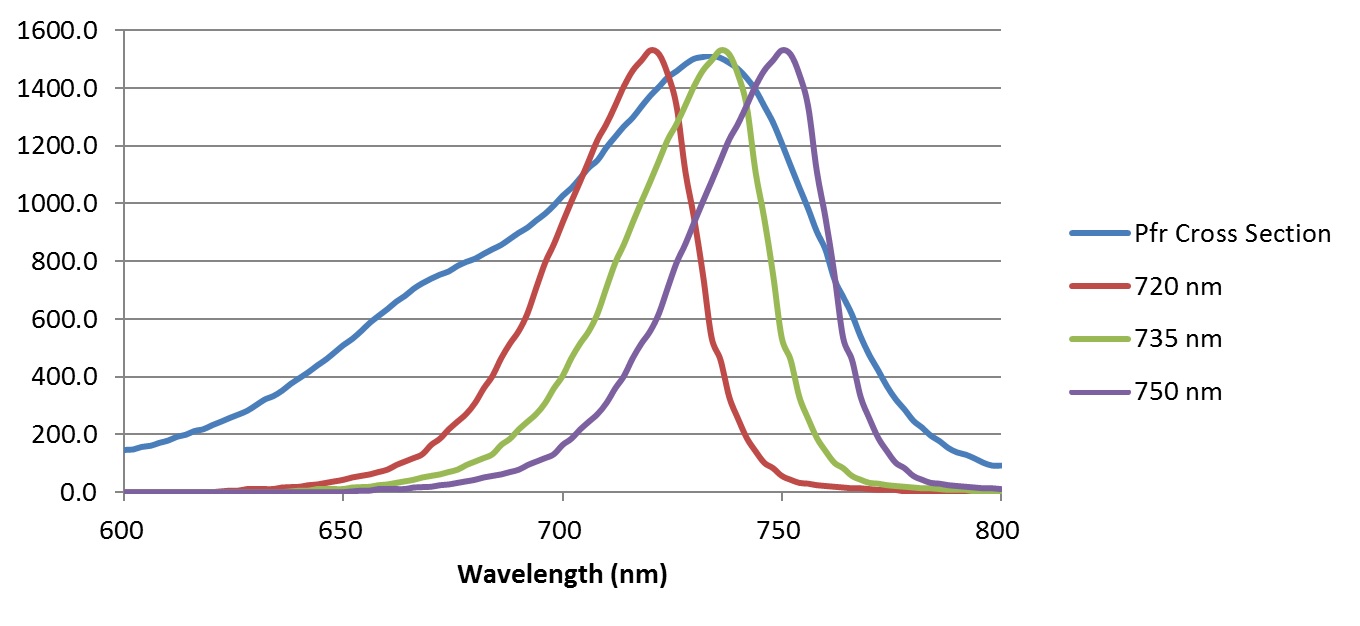
From this information, and assuming that the peak spectral photon intensities of the red and far-red LEDs are the same, the phytochrome photostationary state (PSS) metric values can be calculated as follows:
| Minimum | Typical | Maximum | |
| PSS | 0.3563 | 0.3797 | 0.4036 |
Table 2 – Example PSS values range (2-nm resolution)
In other words, the PSS value may vary by approximately ±6 percent for a given luminaire manufacturer’s product. This is useful information for lighting designers when specifying or qualifying horticultural luminaire products, similar to the meaningful precision of the CRI metric.
There is one further question to address. Sager et al. (1988) reported the photochemical cross-section values σr and σfr at 2-nanometer intervals. This is useful from an academic perspective, but perhaps not so much from that of a photometric testing laboratory. Unless the laboratory performs the LED spectral power distribution measurements in-house, it is likely that the SPDs will be available in 5 nm increments only. While this data can be interpolated at 2-nm intervals for the purposes of calculating the PSS metric in accordance with Equation 2, will the difference in calculated results be significant?
To answer this question, the σr and σfr values published in Sager et al. (1988) were interpolated at 5-nm intervals using a cubic spline approximation, and Table 2 was recalculated using 5-nm resolution for the LED spectral power distributions:
| Minimum | Typical | Maximum | |
| PSS | 0.3639 | 0.3639 | 0.3639 |
Table 3 – Example PSS values range (5-nm resolution)
In this situation, the PSS value may vary by approximately ±5 percent for a given luminaire manufacturer’s product. More significantly, the PSS value for 5-nm resolution was only two percent higher than the PSS value with 2-nm resolution.
These results will of course vary for different typical PSS values, but likely not significantly.
As rules of thumb, therefore:
- Differences in PSS values of less than ±5 percent are likely not significant.
- It likely does not matter whether the PSS values are calculated using 2-nm or 5-nm resolution.
The qualifier “likely” recognizes that, while the PSS metric is some two decades old, greenhouse operators have yet to make use of it as a production tool. Future experience may indicate that these rules of thumb are too lax. In the meantime, however, the above analysis provides some guidance for both lighting designers and horticulturists.
Conclusion
Horticultural lighting presents interesting opportunities for professional lighting designers. It is a rapidly developing field where the use of blue and red LEDs for optimal photosynthesis is only the beginning. Solid state lighting has energized horticultural research into plant responses to light sources with different spectral power distributions, and there will surely be discoveries that improve our understanding of both photosynthesis and photomorphogenesis, as well as improvements in horticultural lighting design.
In the meantime, the phytochrome photostationary state (PSS) metric is an example of existing knowledge that will likely prove useful in designing and specifying horticultural lighting systems.
References
Borthwick, H.A., S. B. Hendricks, M. W. Parker, E. H. Toole, and V. K. Toole. 1952. “A Reversible Photoreaction Controlling Seed Germination,” Proceedings of the National Academy of Science 38:662-666.
Botto, J. F., R. A. S·nchez, G. C. Whitelam, and J. J. Casal. 1996. “Phytochrome A Mediates the Promotion of Seed Germination by Very Low Fluences of Light and Canopy Shade Light in Arabidopsis,” Plant Physiology 110:439-444.
Butler, W. L., K. H. Norris, H. W. Siegelman, and S. B. Hendricks. 1959. “Detection, Assay, and Preliminary Purification of the Pigment Controlling Photoresponsive Development of Plants,” Proc. National Academy of Sciences 45:1703-1708.
Boyle, T. 1992. “Photoperiod Control Systems for Greenhouse Crops,” Floral Notes 4(6):2-4. (See also Photoperiod Control Systems for Greenhouse Crops.)
Garner, W. W., and H. A. Allard. 1920. “Effect of the Relative Length of Day and Night and Other Factors of the Environment on Growth and Reproduction in Plants,” Journal of Agricultural Research 18:553-606.
Islam, M. A., D. Tarkowská, J. L. Clarke, D.-R. Blystad, H. R. Gislerød, S. Torre, and J. E. Olsen. 2014. “Impact of End-of-day Red and Far-red Light on Plant Morphology and Hormone Physiology of Poinsettia,” Scientia Horticulturae 174:77-86.
Lumileds. 2016. DS171 LUXEON SunPlus Series for Horticulture, Lumileds Product Datasheet 20160908.
Sager, J. C., W. O. Smith, J. L. Edwards, and K. L. Cyr. 1988. “Photosynthetic Efficiency and Phytochrome Equilibria Determination Using Spectral Data,” Trans. ASAE 31(5):1882-1889.
Smith, H. 2000. “Phytochromes and Light Signal Perception by Plants — An Emerging Synthesis,” Nature 407:585-591.
van Trigt, C. 1999. “Color Rendering, A Reassessment.” Color Research & Application 24(3):197-206.
0 Comments
Trackbacks/Pingbacks