
Abstract
Whereas human vision relies on five opsins as photoreceptors, most plants have a wide variety of photopigments that are responsive to optical radiation from 280 nm to 800 nm. Beyond photosynthesis, plants rely on this radiation to control photomorphogenesis, phototropism, shade avoidance, and both circadian and circannual rhythm entrainment.
Quasimonochromatic LEDs have proven a boon for botanists in that the molecular genetics of these responses can be elucidated with precisely controlled spectral power distributions (SPDs). In terms of photopigments, cryptochromes, for example, respond to blue light, while phytochrome responds to the R:FR ratio of red (approximately 660 nm) to far-red (approx. 735 nm) light.
The problem is that botanists do not define what is meant by “blue,” “green,” “yellow,” “red,” or “far-red” visible light, while ultraviolet radiation is broadly defined as UV-A and UV-B. Consequently, it is difficult to replicate laboratory experiments without knowing the SPD of the horticultural light source.
This paper proposes an LED “color” specification that represents a given SPD using a small number of radial basis functions, to provide a metric for comparing biologically similar SPDs. It further introduces a trainable fuzzy logic SPD classifier that can compare biologically similar SPDs for specific horticultural applications.
Introduction
When the first high-pressure sodium (HPS) lamps were introduced in the late 1960s, they were quickly adopted by commercial greenhouse operators as a means of providing supplemental electric lighting. This made it economically possible to grow vegetables and flowers throughout the year in controlled environments. They had luminous efficacies, ranging from 100 to 150 lumens per watt, they were available in sizes ranging from 400 to 1,000 watts, and they could be incorporated in luminaire housings designed to withstand the heat and humidity of greenhouses.
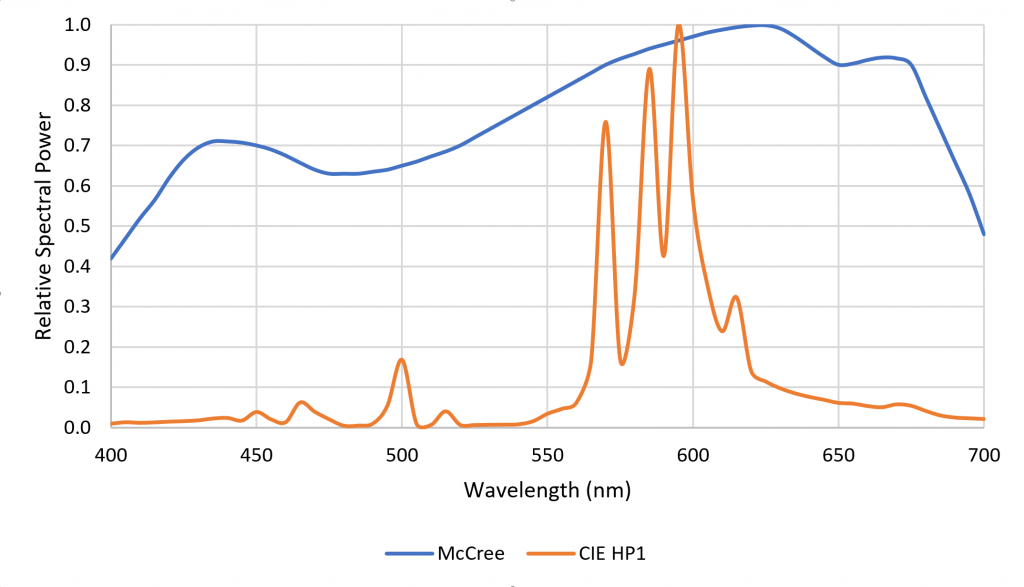
One disadvantage of HPS lamps is they produce mostly yellow light with fixed spectral power distributions (SPDs). This is not particularly important for plant photosynthesis, as most plants can take advantage of optical radiation within the spectral range of 400 to 700 nm. Horticulturalists often refer to the “McCree curve,” which plots average photosynthesis efficiency versus wavelength for a variety of field-grown crops (McCree 1972). As shown in Figure 1, the spectral output of HPS lamps is near the peak of the McCree curve.
The problem is that while the yellow light of HPS lamps may be good for photosynthesis, plants have a wide range of photopigments that respond to optical radiation from 280 nm to 800 nm (often referred to as “photobiologically active radiation,” or PBAR). These responses include:
- Photomorphogenesis – any change in the morphology (i.e., shape) or composition of a plant or its components that is induced by optical-radiation exposure
- Photoperiodism – response of a plant to daily (circadian) or seasonal (circannual) changes in optical-radiation exposure
- Photosynthesis – conversion of “photosynthetically active radiation” (PAR) into chemical energy stored as carbohydrates to fuel plant activities
- Phototropism – any self-actuated change in the orientation of a plant or its components toward or away from optical radiation
- Secondary metabolite production – organic compounds not directly involved in plant growth, development, or reproduction, including compounds used as medicines, flavorings, pigments, and drugs
- Shade avoidance – a set of responses to being shaded by other plants, including changes in morphology, flowering times, and allocation of resources
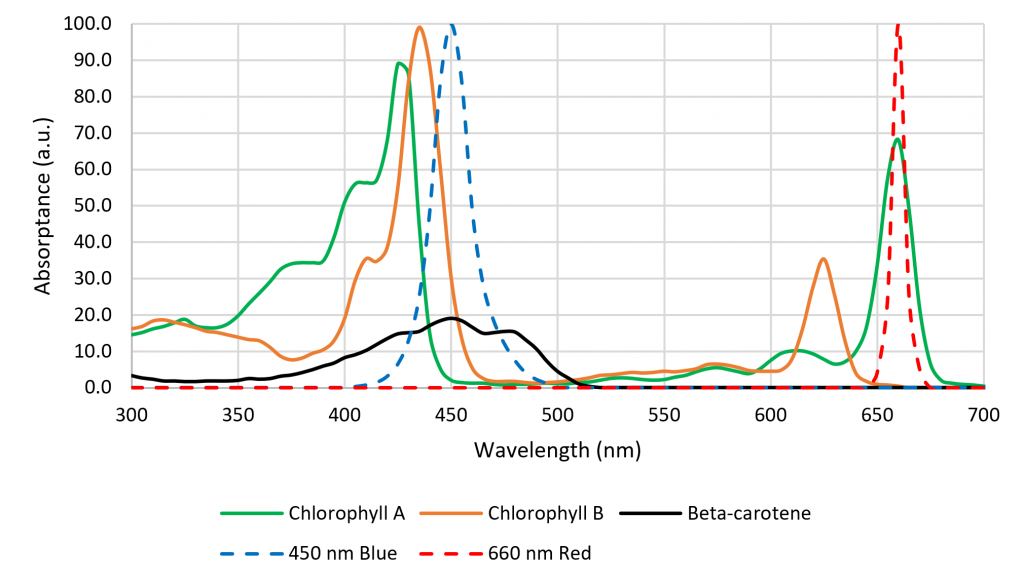
While many of these responses have been known or suspected for decades, it was difficult for botanists to study them in the laboratory without suitable light sources. This changed, however, with the introduction of horticultural luminaires with high-flux quasimonochromatic light-emitting diodes (LEDs). Somewhat serendipitously, the absorption spectra of chlorophyll A and B have peaks that correspond with those of approximately 450-nm InGaN and approx. 660-nm AlInGaP LEDs (Figure 2). Today, the photon efficacy (measured in micromoles of PAR photons per Joule, rather than in lumens) of LED modules is typically greater than equivalent 1,000-watt HPS lamps.
While commercially available horticultural luminaires with blue and red LEDs (producing so-called “blurple” light) are now successfully competing with traditional HPS luminaires, botanists’ attention has turned to the capabilities of multichannel LED luminaires with controllable SPDs. Over 500 academic studies over the past decade have investigated the effects of different wavelength ranges on plants and their absorption by photopigments (Table 1).
| Wavelength Range | Color Name | Photopigments | Responses |
| 280 nm – 315 nm | UV-B | UVR-8 | Sec. metabolism Shade avoidance Phototropism |
| 315 nm – 400 nm | UV-A | Chlorophylls Cryptochromes Phototropin Phytochromes Zeitlupe family |
Sec. metabolism Photomorphogenesis |
| 400 nm – 500 nm | Blue | Carotenes Chlorophylls Cryptochromes Phytochromes Zeitlupe family |
Photosynthesis Sec. metabolism Shade avoidance Phototropism Photoperiodism |
| 500 nm – 575 nm | Green | Cryptochromes | Photosynthesis Sec. metabolism Shade avoidance |
| 575 nm – 610 nm | Yellow – orange |
<Unknown> | Photosynthesis Sec. metabolism |
| 610 nm – 700 nm | Red | Chlorophylls Phytochromes |
Photosynthesis Photomorphogenesis Sec. metabolism Shade avoidance Photoperiodism |
| 700 nm – 800 nm | Far-red | Phytochromes | Photomorphogenesis Shade avoidance Photoperiodism |
The problem is that while UV-A and UV-B are formally defined in the scientific literature (e.g., ISO 2007), the visible color names are colloquial and based on human visual responses. The title of one paper in particular illustrates this issue: “Green light drives leaf photosynthesis more efficiently than red light in strong white light: Revisiting the enigmatic question of why leaves are green” (Terashima 2009). For anyone interested in either replicating the experiments or extrapolating their results, what are “green,” “red,” and “white” light?
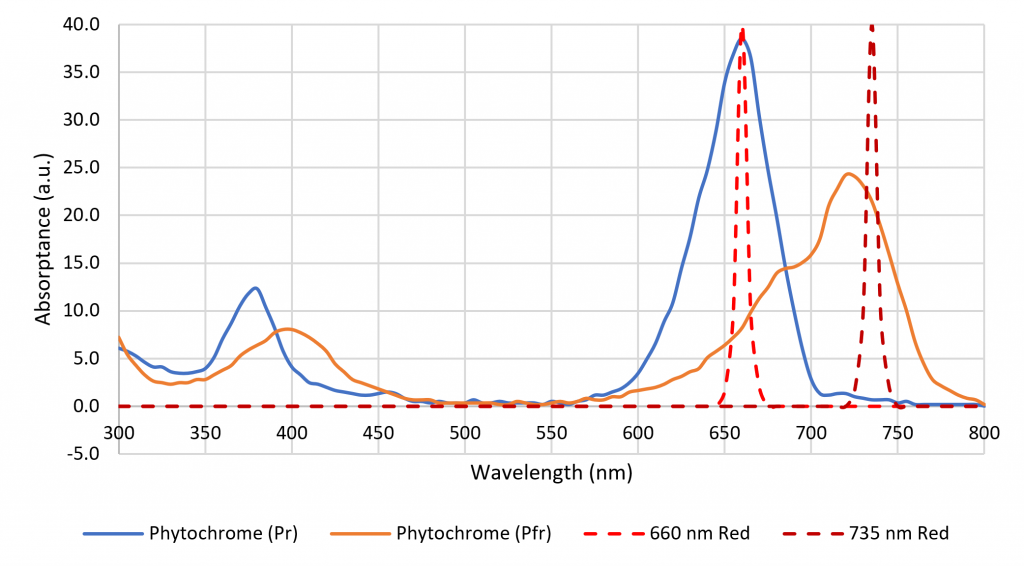
The color name “far red,” which refers to the spectral range of 700 nm to 800 nm, is formally defined in terms of horticulture (ASABE 2017). It is important in terms of shade avoidance and photoperiodism, where plants rely on two isoforms of phytochrome to detect the ratio of red to far red (R:FR) optical radiation (Sager et al. 1988), but there is no equivalent definition of “red” (Figure 3). Luminaire manufacturers are now offering products with 660-nm red and 735-nm far-red LEDs to induce or delay flowering in ornamental plants (e.g., Craig and Runkle 2013), but many previous horticultural studies have relied on daylight alone or daylight and incandescent lamps to explore the effects of varying R:FR. How should these studies be interpreted in terms of modern horticultural lighting practices with LED-based luminaires?
Characterizing SPDs
Horticultural researchers have recognized that the use of colloquial color names is a problem. Many papers describe their experimental methods in detail, including light source SPD plots, names of specific luminaire products, and occasionally tabulated SPDs. This still leaves open, however, the problem of interpreting the results in terms of other optical radiation sources with similar SPDs.
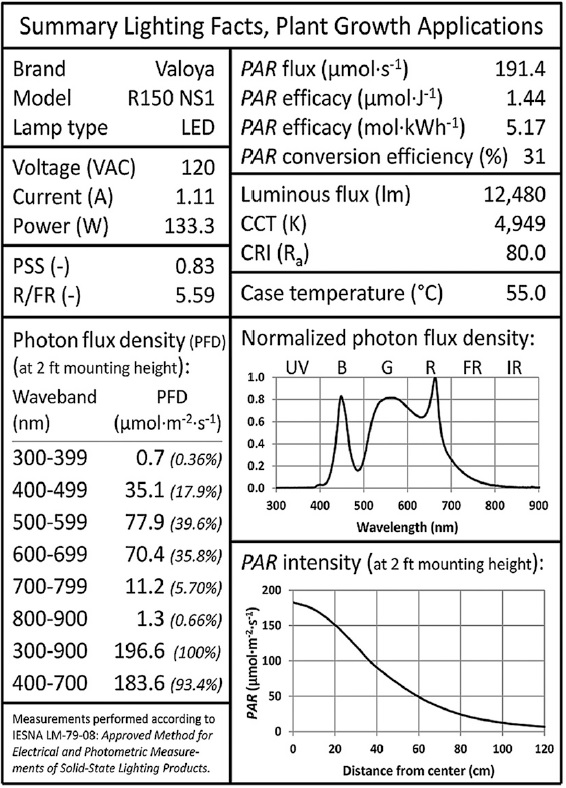
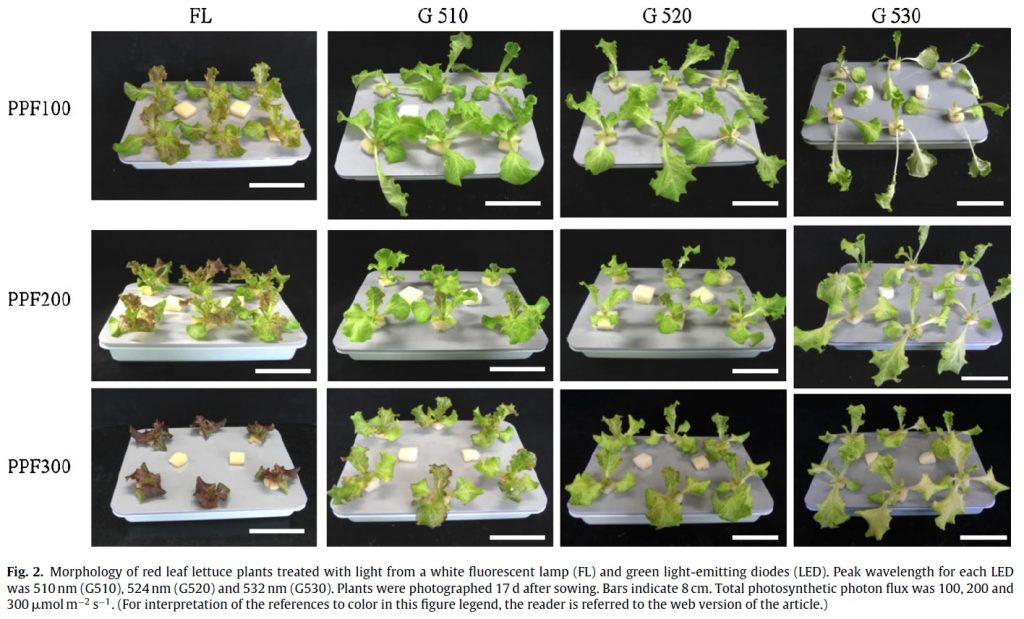
One proposed product label for horticultural light sources is shown in Figure 4 (Both et al. 2017). By avoiding the use of color names, this proposal eliminates any dependence on the human visual system. However, the arbitrary separation of the PBAR spectral range into 100-nm wide bands ignores the distinct responses of plants to UV-A and UV-B radiation, as well as the response of plants to narrower changes in wavelength. For example, Johkan et al. (2012) provide an example wherein the growth of lettuce under quasimonochromatic radiation from “green” LEDs with center wavelengths of 510 nm, 520 nm, and 530 nm varies markedly depending on the center wavelength for the same photosynthetic photon flux density (Figure 5).
The spectral absorptance characteristics of the primary plant photopigments chlorophyll A and B, b-carotene, and phytochrome (Figure 2) suggest that their absorptances vary very rapidly with changes in wavelength. However, these data represent the spectral absorptance of the pigment extracts dissolved in solvents (i.e., in vitro). As shown by Moss and Lewis (1952), a combination of the structural complexity of the leaves, screening by other photopigments, and the presence of accessory photopigments have the effect of broadening the spectral absorptance characteristics of the photopigments in vivo. Studies such as those of McCree (1972) have shown that in general, plants are reasonably tolerant of small changes in the center wavelengths of quasimonochromatic radiation. (Johkan et al. [2012] was likely an exception in that photosynthesis probably occurred due to b-carotene rather than chlorophyll A or B, with longer wavelengths of green light being incapable of exciting this photopigment.)
In view of this and other studies, it is clear that any attempt to characterize the SPDs of horticultural luminaires needs to take into consideration the responses of plants to changes in center wavelength of quasimonochromatic light sources, and more generally to horticultural luminaires with both quasimonochromatic and broadband radiation sources.
In relation to this, Maloney (1986) discusses the physical basis of spectral reflectance distributions from natural objects, including organic materials. These distributions are band-limited by molecular interactions and superimposed vibrational and rotational patterns, with the result that the number of parameters needed to adequately represent spectral reflectance distributions in visible light (i.e., 400 nm to 700 nm) is five to seven. Westland et al. (2000) came to a similar conclusion based on statistical studies of reflectance spectra, noting that the spectral reflectance distributions of most natural surfaces form a set of band-limited functions with a frequency limit of approximately 0.02 cycles per nm. This implies that visible light reflectance spectra can be adequately represented using six to 12 basis functions (e.g., Westland and Ripamonti 2004).
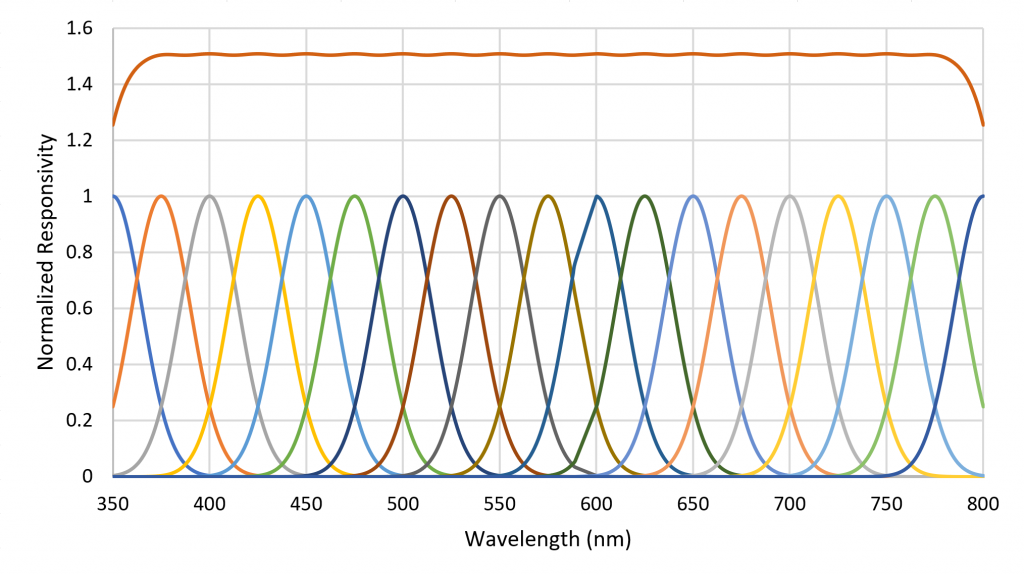
A small number of radial basis functions (e.g., Buhmann and Jäger 2000) can therefore be used to approximate a real-valued function (such as an SPD) as a weighted sum of the basis functions. As an example, the set of Gaussian functions , where , and for , can be used to approximate any SPD from 350 nm to 800 nm where the functions are separated by 25 nm (Figure 6).
An advantage of this method is that the set of basis function weights is much smaller than the set of enumerated values for a measured SPD. Rather than referring to “red,” “green,” “blue,” or “white” light, horticulturalists can state the values of a set of basis function weights. Moreover, a useful approximation of the original SPD significant to the needs of horticultural lighting can be reconstructed from these weights.
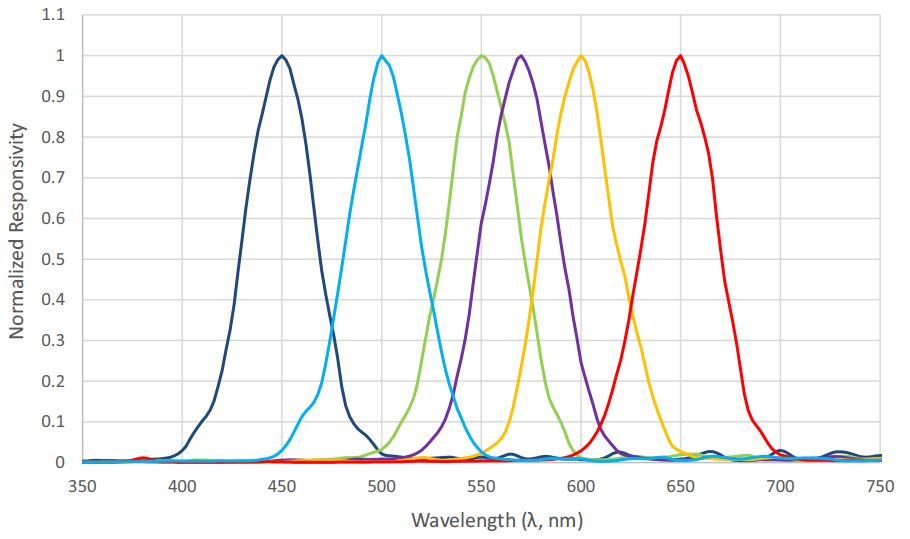
As an example, Figure 7 shows 13 radial basis functions over the visible light range of 400 nm to 700 nm that are each multiplied on a per-wavelength basis by the SPD of a 4000-K white light LED to yield the basis function weights.
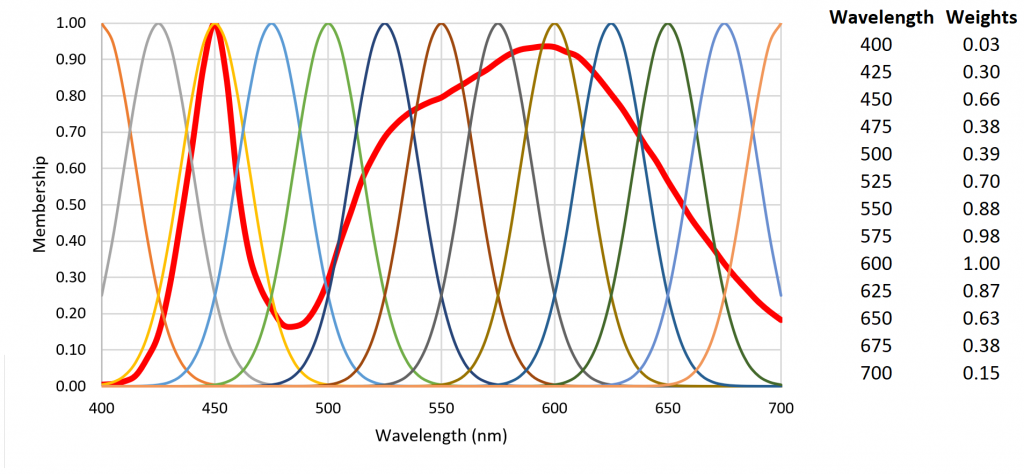
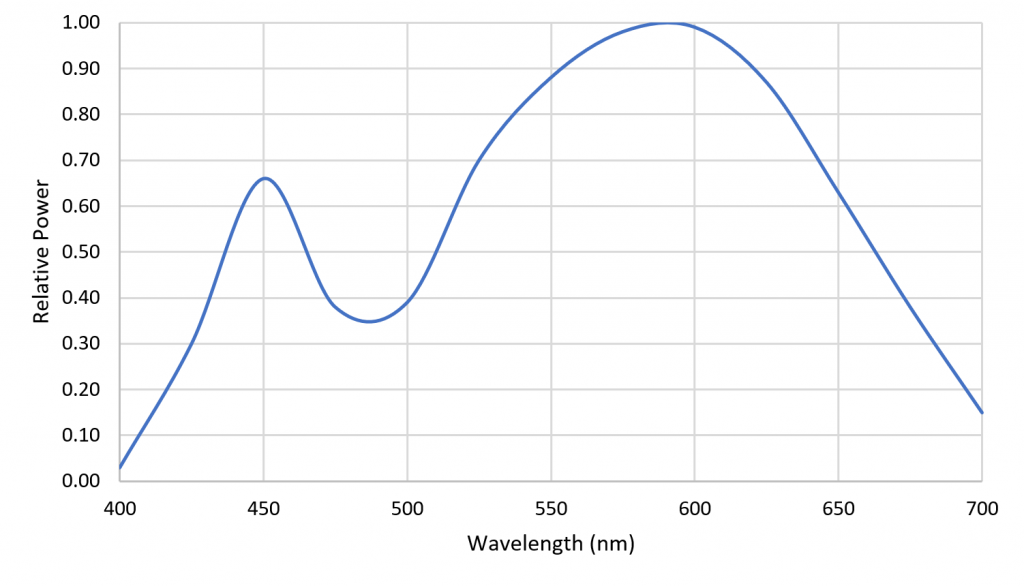
Figure 8 shows a reconstruction of the LED SPD using a cubic spline curve with the weights as knots. The reconstruction is clearly different from the original SPD, but in terms of predicting plant responses, it is likely adequate.
Horticultural Spectral Sensor
Referring to Figure 6, each basis function can be seen as the responsivity of a radiant flux meter in combination with a Gaussian bandpass filter with a center wavelength of xi. Combining the unweighted outputs of the 19 filtered meters results in a flat response from 375 nm to 775 nm. Presented with an arbitrary SPD, the filtered meter outputs represent the appropriate weighting for the basis functions to approximate the SPD. Moreover, the absolute values of the filtered meter outputs can be used to estimate the absolute spectral irradiance incident on the meters, from which can be calculated the absolute irradiance in watts per square meter and the photosynthetic photon flux density (PPFD) in micromoles per square meter per second.
Figure 9 shows the spectral responsivities of an AS7262 6-channel visible light spectral sensor with a spectral range of approximately 430 nm to 570 nm, as manufactured by ams AG of Premstaetten, Austria. While the spectral responsivities are not ideal Gaussian functions, it is clear that an instrument to directly measure radial basis function weights can be fabricated using existing technology.
An advantage of this system and method in terms of horticultural light sources is that the spectral power distributions can be unambiguously measured and expressed as a small set of numbers, regardless of the SPD complexity. If the representations of two SPDs are similar, the horticulturalist may be assured that they will likely have the same biological effect on a plant species. As an example, white light fluorescent lamps typically exhibit a combination of continuum and line spectra, whereas white light LEDs typically exhibit a narrow peak emission near 450 nm and a broad continuum from the blends of green- and red-emitting phosphors (e.g., Figure 7). Regardless, if their sets of radial basis function weights are similar, the two light sources may also be regarded as similar with respect to horticultural applications.
Fuzzy Logic SPD Classifier
The unanswered question is, what does “similar” mean in the context of comparing two or more SPD representations? With 13 to 19 radial basis function weights as parameters, it becomes impractical to formulate a table of rules for comparison purposes. The solution to this problem is a fuzzy logic classifier.
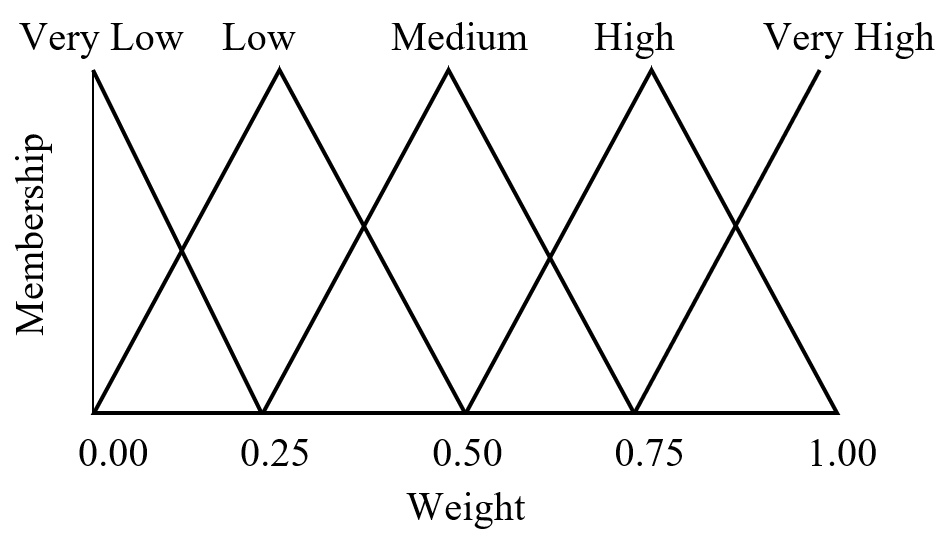
Fuzzy logic is often seen as a mathematical means of representing vagueness and imprecise information when making decisions, where input signals are “fuzzified” by mapping their precise values to a set of fuzzy membership functions. Referring to Figure 10 as an example, a radial basis function with weight 0.85 has membership 0.60 in “high” and membership 0.40 in “very high.” (Triangular membership functions are used in this example, but trapezoidal and sigmoid functions may also be used.)
Referring to Figure 7, the fuzzification of the set of 13 radial basis function weights results in Table 2.
Table 2 – Fuzzification of 4000-K White Light LED SPD
| Wavelength | Weight | Very Low | Low | Medium | High | Very High |
| 400 | 0.03 | 0.88 | 0.12 | 0.00 | 0.00 | 0.00 |
| 425 | 0.30 | 0.00 | 0.80 | 0.20 | 0.00 | 0.00 |
| 450 | 0.66 | 0.00 | 0.00 | 0.36 | 0.64 | 0.00 |
| 475 | 0.38 | 0.00 | 0.48 | 0.52 | 0.00 | 0.00 |
| 500 | 0.39 | 0.00 | 0.44 | 0.56 | 0.00 | 0.00 |
| 525 | 0.70 | 0.00 | 0.00 | 0.20 | 0.80 | 0.00 |
| 550 | 0.88 | 0.00 | 0.00 | 0.00 | 0.48 | 0.52 |
| 575 | 0.98 | 0.00 | 0.00 | 0.00 | 0.08 | 0.92 |
| 600 | 1.00 | 0.00 | 0.00 | 0.00 | 0.00 | 1.00 |
| 625 | 0.87 | 0.00 | 0.00 | 0.00 | 0.52 | 0.48 |
| 650 | 0.63 | 0.00 | 0.48 | 0.52 | 0.00 | 0.00 |
| 675 | 0.38 | 0.48 | 0.52 | 0.00 | 0.00 | 0.00 |
| 700 | 0.15 | 0.40 | 0.60 | 0.00 | 0.00 | 0.00 |
The set of n fuzzified weights for a given SPD is then submitted to a fuzzy if-then rule system. Given any two fuzzified weights x1 and x2 as inputs, a typical fuzzy rule will be:

where there are multiple output classes.
Each rule calculates a “vote” t that is determined by degree of membership m for each fuzzified weight:

and where the fuzzy AND operator is implemented as the minimum of the two membership values.
Once all of the rules have been processed, their votes are aggregated:
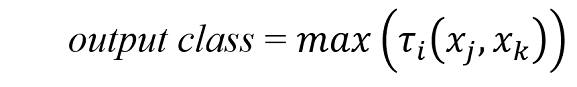
for all votes.
This is arguably the simplest possible implementation of a fuzzy logic classifier. There are other methods for calculating and aggregating votes that are likely better for the purpose, but it is the principle that is of interest. What a fuzzy logic classifier accomplishes is a framework for representing expert knowledge of the effect of similar but different SPDs on plant growth and health, taking into consideration the plant species, plant growth stage, plant environmental conditions, and other parameters. In a sense, the fuzzy if-then rules formalize what is known about plant responses to optical radiation (e.g., Table 1) and classify horticultural luminaire SPDs accordingly.
Summary
While light-emitting diodes have provided botanists with the ability to generate precisely controlled SPDs for their research, the use of colloquial color names in their published papers has made it difficult to interpret and summarize their research results for the horticultural industry. This paper therefore proposes the use of a small number of radial basis functions to represent SPDs for horticultural lighting purposes, based on the observation that the absorption characteristics of photopigments in vivo limits the need for more-detailed SPDs. A proposal for a horticultural spectral sensor that measures radial basis function weights directly is also introduced.
Finally, a fuzzy logic classifier is proposed as a means of representing expert knowledge gained from horticultural research using fuzzy if-then rules, thereby resolving the problem of determining the similarity of two or more SPDs for horticultural lighting purposes.
References
ASABE. 2017. ANSI/ASABE S640 JUL2017, Quantities and Units of Electromagnetic Radiation for Plants (Photosynthetic Organisms). St. Joseph, MI: American Society of Agricultural and Biological Engineers.
Both A-J et al. 2017. Proposed product label for electric lamps used in the plant sciences. Hort Technol. 27(4):544-549.
Buhmann, MD, Jäger J. 2000. On radial basis functions. Acta Numerica. 9:1-38.
Craig DS, Runkle ES. 2013. A moderate to high red to far-red light ratio from light-emitting diodes controls flowering of short-day plants. J Am Soc Horticult Sci. 138(3):167-172.
Kuehni RG. 2003. Color Space and Its Divisions. Hoboken, NJ: John Wiley & Sons.
ISO. 2007. ISO 21348:2007(E). Space Environment (Natural and Artificial – Process for Determining Solar Irradiances. Geneva, Switzerland: ISO.
Johkan M et al. 2012. Effect of green light wavelength and intensity on photomorphogenesis and photosynthesis in Lactuca sativa. Environ Exper Botany. 75:128-133.
Maloney L. 1986. Evaluation of linear models of surface spectral reflectance with small number of parameters. J Opt Soc Am. 3(10):1673-1683.
McCree KJ. 1972. The action spectrum, absorptance and quantum yield of photosynthesis in crop plants. Agric Meteorology. 9:191-216.
Moss RA, Lewis WE. 1952. Absorption spectra of leaves. I. The visible spectrum. Plant Physiol. 27(2):370-391.
Sager JC et al. 1988. Photosynthetic efficiency and phytochrome equilibria determination using spectral data. Trans ASABE. 31(5):1882-1889.
Terashima I et al. 2009. Green light drives leaf photosynthesis more efficiently than red light in strong white light: Revisiting the enigmatic question of why leaves are green. Plant Cell Physiol. 50(4):684-697.
Westland S et al. 2000. Colour statistics of natural and man-made surfaces. Sensor Rev. 20(1):50-55.
Westland S, Ripamonti C. 2004. Computational Color Science Using Matlab, Chapter 10. Chichester, UK: John Wiley & Sons.
0 Comments