
Introduction
This article is based on a presentation I had the pleasure of delivering at the recent Canada Light Expo 2025 in Toronto. My aim with the presentation was to offer a brief overview of some key aspects of horticultural lighting and to highlight how it differs from architectural lighting. I was surprised by the number of requests to share the fundamentals from the presentation with colleagues, clients, or other acquaintances. To make the information more accessible, I am summarising it here as an article.
What is horticultural lighting?
Horticultural lighting refers to artificial lighting systems specifically designed for plant growth. These systems can supplement sunlight, such as in greenhouses, or completely replace sunlight, as in indoor farms. Using artificial lighting enables growers to control light intensity, spectrum, duration, and timing. Especially with the rise of LED luminaires, options for customisation and control have significantly increased.
Artificial lighting systems also support local food production and enable cultivation in urban or challenging environments. This could become increasingly essential as climate change continues to affect regions worldwide, impacting the ability to grow crops naturally. For example, the Plant Hardiness maps for Canada were updated in 2025 (see Figure 1), reclassifying about 80% of the country and nearly all major population centres [McKenney 2025].
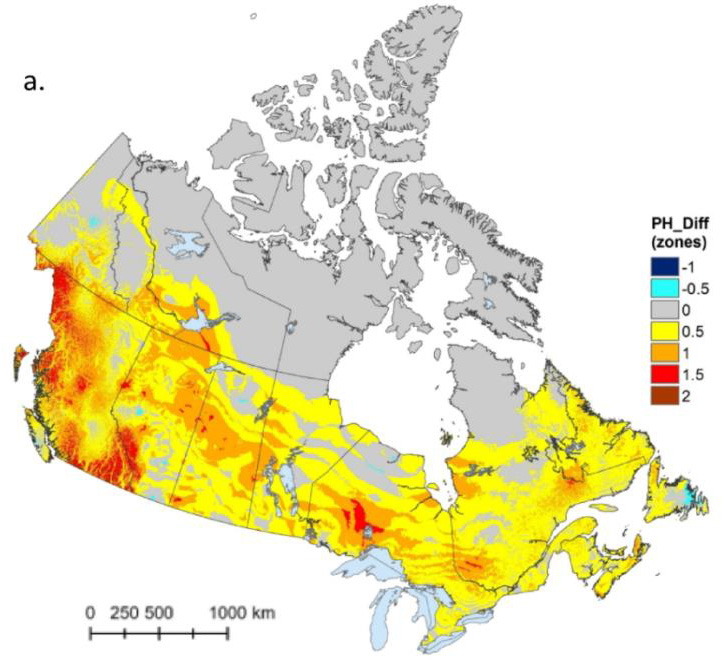
Figure 1: Canadian plant hardiness zones for 1991–2020 period minus 1961–1990 period. In most of the country, the plant hardiness zone has increased 0.5 to 1.5 steps.
Horticultural lighting is essential because growing crops is critical for human survival. By creating controlled artificial systems, lighting can be precisely tuned to offset factors like overcast weather or shorter winter days. Growers can modify the spectrum, intensity, timing, and duration of light to suit the specific needs of different crops. In fact, growers often have dedicated light recipes for specific crops that specify a customised spectrum best suited for them. Beyond supplementing suboptimal conditions, controlling grow lighting can enhance yield, quality, and the timing of plant production regardless of season or weather.
Metrics for horticultural lighting
There are several important metrics in horticultural lighting. By light, we are generally referring to the band of electromagnetic radiation within wavelengths visible to the human eye. For plants, we focus on two main wavelength ranges. Photosynthetically Active Radiation (PAR) is the range of light used for photosynthesis. This range (400 – 700 nm) is comparable to human visible light. PAR accounts for 45% of total solar energy and forms the basis for many other horticultural measurements. It is commonly used to calculate light delivery to plants and to design lighting systems because it directly correlates with plant photosynthetic activity. However, it does not provide a complete picture of how light influences plant growth.
While PAR covers the spectrum of light used in photosynthesis, many other plant processes also rely on light. Photobiologically Active Radiation (PBAR) is a broader range that includes all the light a plant detects (see Figure 2). PBAR (roughly 280 – 800 nm) encompasses not only the photosynthetically active wavelengths but also UV and far-red light, which, although they do not directly initiate photosynthesis, still have strong regulatory effects on plant development. UV-B light can trigger protective pigment production or stress responses associated with excessive or intense sunlight [Shi 2021]. Far-red light can influence flowering and promote shade-avoidance responses [Franklin 2008].
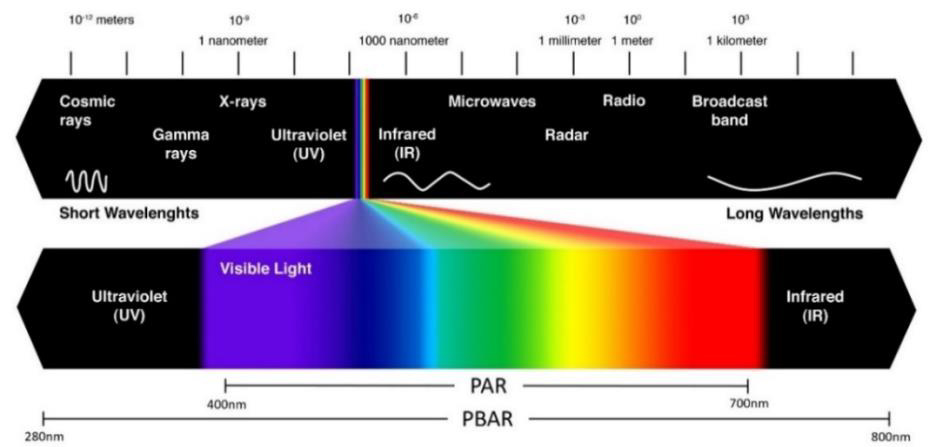
Figure 2: The PAR and PBAR range within the wider spectrum of electromagnetic radiation.
When classifying luminaires for human use, we measure light in lumens and lux. These units describe light as humans perceive it by weighting visible wavelengths according to the well-known V(λ) function. Horticultural lighting uses two analogous metrics. The horticultural equivalent of lumens is photosynthetic photon flux (PPF), which measures the number of photons in the PAR range emitted by a light source over time. PPF is expressed in micromoles per second (µmol/s) and quantifies how much useful light for photosynthesis a luminaire produces. Photosynthetic photon flux density (PPFD) functions as the horticultural counterpart to lux and measures the amount of PPF incident on a surface such as a plant canopy. It gives a measure of how much PPF is delivered to a plant, and thus considers both the type of luminaires used and their placements relative to the surface. PPFD is measured in micromoles per second per square metre, µmol/(s·m2).
It is of note that PPF and PPFD, unlike lux and lumens, do not weigh photons of various wavelengths within the PAR range differently. These metrics count all photons within that range equally. However, plants are sensitive to the spectral distribution of light and can detect differences through multiple photoreceptors, such as being more responsive to blue and red light for photosynthesis [McCree 1972] (See Figure 3.) Furthermore, the specific sensitivities vary among different plant species, meaning that ideally different weighting would be needed for different crops. As a result, specialised light recipes are often used, which specify the spectral power distribution best suited for a particular crop and its specific requirements.
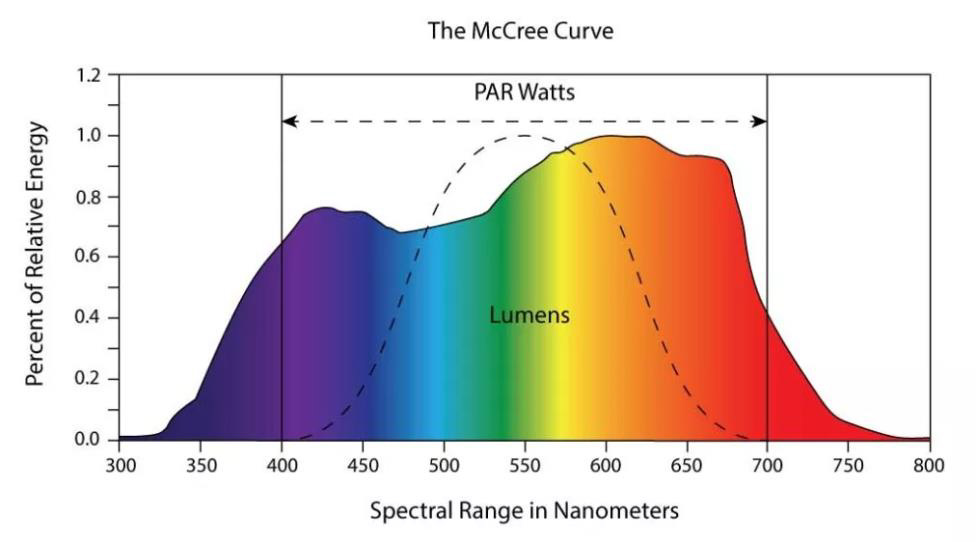
Figure 3: The McCree Curve, displaying an average efficiency of different wavelengths for driving photosynthesis. PPFD does not take this or any weighting by wavelength into account. The dashed line shows the V(λ) curve for calculating lumens.
Daily Light Integral (DLI) is a useful derived metric of PPFD. DLI represents the total number of photons in the PAR range accumulated over a day and is measured in micromoles per square metre per day, µmol/(m2·day). It is a commonly used metric for quantifying the amount of light delivered on a macro scale, for example through maps of average DLI for each month in a region; an example is shown in Figure 4. This tool helps quickly identify how much light a particular region receives throughout the year and can assist in determining suitable crop types or how much supplemental lighting is needed to support a specific crop. An online DLI calculator can be accessed at https://dli.suntrackertech.com/, which provides and visualises DLI worldwide based on weather station and satellite data.
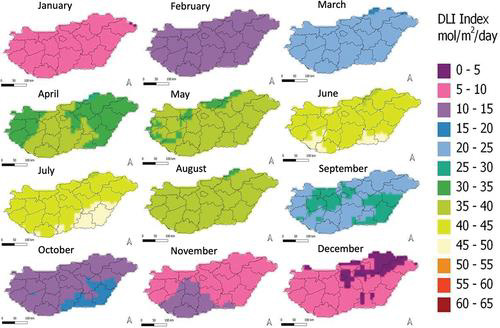
Figure 4: A map displaying average DLI for each month of the year across a region. A higher DLI value corresponds to more PAR light delivery per day.
Light effects on plants
One excellent example of the impact of far-red light is the red to far-red ratio (R:FR ratio). Far-red light has a wavelength of approximately 700 – 800 nm and lies between visible red light and infrared light. Plants use photoreceptors called phytochromes, which switch between two forms that absorb red and far-red light. When a plant receives direct sunlight, the ratio is high (more red light), which can lead to denser foliage growth. If the ratio is low, it is often an indicator for the plant that it is not getting enough direct light. In the wild, this typically means other plant canopies or obstacles are blocking the sunlight. This triggers shade avoidance, whereby a plant often experiences stem elongation and develops larger but thinner leaves to increase its surface area and outgrow the obstruction. Figure 5 shows a personal experience with a tomato plant I attempted to grow on my balcony. Unfortunately, due to insufficient direct light, the plant grew tall and spindly until it eventually cracked under its own weight.
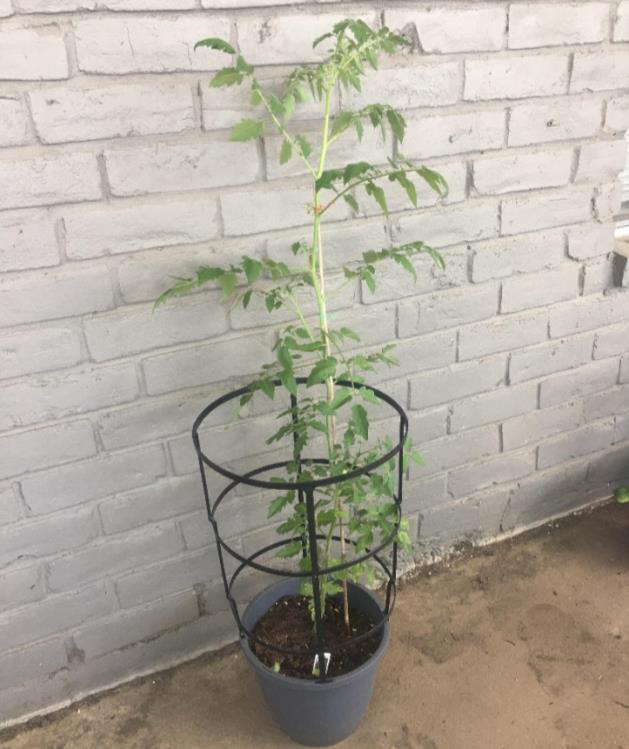
Figure 5: A tomato plant which has experienced a lack of sunlight, causing a shade avoidance response in the form of stem elongation. It has grown tall and spindly to try and reach sunlight.
For wavelengths of light within the PAR spectrum, photosynthetic efficiency generally peaks in the red and blue parts of the spectrum (see Figure 6). Notably, providing both red and blue light is more effective than an equivalent amount of PPFD of either one alone. A common setup for plant lighting is this combination of blue and red light. While R/B lighting can be sufficient, adding other wavelengths often increases levels of photosynthesis and can influence other processes such as flowering, leaf growth, and secondary metabolism. Green wavelengths, for example, although not ideal as a sole light source, have been shown to complement R/B lighting effectively. Green light may penetrate deeper into and through leaves, benefiting lower canopy leaves. A comparative study using full spectrum LEDs, including and excluding green light (480-560 nm), showed that the presence of green light increased rates of photosynthesis, dry mass, and leaf size [Liu 2017, 2018].
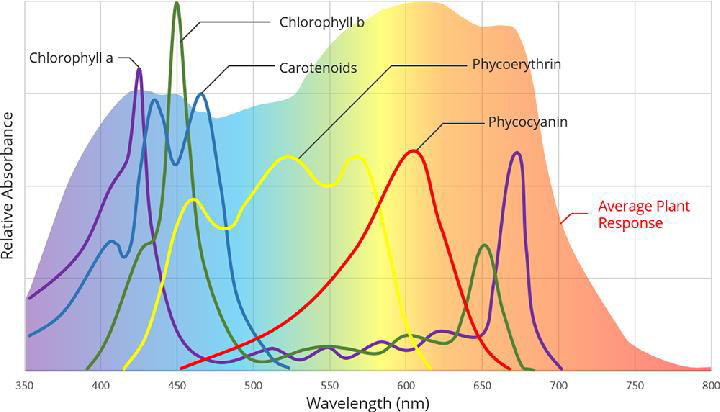
Figure 6: A plot of an average photosynthetic response of a plant. The plot shows the overall response as well as each pigment’s individual response.
Another aspect of lighting is the temporal effect on plant growth. When using supplemental lighting, the “night” can be shortened or even eliminated entirely. With a fully artificial setup, there is no need to even follow a 24-hour day-night cycle. For most plants, a dark period is beneficial and triggers mechanisms that do not activate during daylight. Many plants use photoperiodism to detect seasonal changes, with the length of night influencing when flowering occurs. For instance, some cannabis growers use long day periods during the vegetative phase until plants are large enough, then switch to a more balanced day-night cycle to induce flowering [Jin 2019]. Temporal effects have also been examined on a much shorter scale with pulsed lighting. One study compared lettuce growth under continuous and pulsed lighting, where the pulsed light had a 50% duty ratio at 1 kHz. Results showed 32% more fresh biomass and 48% more leaf area in crops grown under pulsed lighting compared to those under continuous light with the same DLI [Miliauskiené 2021].
Admittedly, results are often specific and cannot necessarily be generalised from the specific species tested. For example, here are some studies from the past decade that highlight the complexity:
- Indoor experiments may not always reflect plant responses under natural conditions [Annunziata 2017]
- R/B LEDs boost biomass, yield, and antioxidants in basil and strawberries [Piovene 2015]
- Increasing levels of blue light decreases the growth rate and leaf area in cucumbers [Hernández 2016]
- LEDs offer similar effects as HPS on tomato fruit quality [Dzakovich 2015, 2017]
- Lettuce plants treated with supplemental blue light become compact, and photosynthetic efficiencies decrease in red, but not green lettuce [Ouzounis 2015]
Most of these articles report results of specific lighting effects on one or two crop species. In some cases, the results conflict regarding their effects, too. For example, the findings suggest that blue light benefits basil and strawberry yields but reduces the growth rate of cucumbers. It would take a lot more resources to gain a broader understanding of patterns that apply across multiple species and those that vary individually. Further research into the inherent mechanisms of plants will also continue to enhance our knowledge, as we better understand which plant mechanisms are influenced by certain wavelengths of light.
Another key factor to consider is that the growth stage influences the needs of the plant and how different lighting impacts it. Even within the same species, optimal lighting requirements vary throughout its lifecycle, including the seeding, sprouting, growth, flowering, and ripening stages. Not all of these stages are present in every plant, and in some cases, there can be overlap.
Summary
Many of the fundamental factors in horticultural lighting have been discussed, from the metrics used to the effects different lighting systems can have on plants. We have also encountered one of the biggest challenges in horticultural lighting: the inherent variability across species. When designing lighting for humans, only one species needs to be considered. Even with individual variability, we work with ranges based on a single mean and standard deviation to establish safe and comfortable limits and regulations for the population. In contrast, plants encompass thousands of species, each with its own variability.
Another important design question is, what defines ‘good’ horticultural lighting design for a specific project? What are we aiming to optimise for? Possible goals include growth rate, yield, aesthetics, hardiness, leaf area, dry volume, or spiciness. Rather than providing a definitive guide for addressing each unique horticultural objective, this article aims to offer the essential tools to start critically thinking about the considerations and concerns involved in designing a horticultural lighting system.
About the author
Alex Willemsen is a Software Developer and Researcher at Suntracker Technologies in Victoria, BC, where he develops lighting simulation software for architectural and horticultural lighting. His initial entry into the lighting industry was in 2021, working in a lighting lab at the Swedish Energy Agency in Stockholm, Sweden, focusing on flicker and stroboscopic effects. Stockholm is also where he earned his Bachelor’s in Engineering Physics and Master’s in Computer Science from KTH Royal Institute of Technology. Alex is an active and contributing member of the All Things Lighting Association. He can be reached at alexander.willemsen@suntrackertech.com.
References
Annunziata MG, Apelt F, Carillo P, et al (2017) Getting Back to Nature: A Reality Check for Experiments in Controlled Environments. J Exp Bot 68:4463–4477. doi: 10.1093/jxb/erx220
Dzakovich MP, Gómez C, Ferruzzi MG, Mitchell CA (2017) Chemical and Sensory Properties of Greenhouse Tomatoes Remain Unchanged in Response to Red, Blue, and Far Red Supplemental Light from Light-emitting Diodes. HortScience 52:1734–1741. doi: 10.21273/HORTSCI12469-17
Dzakovich MP, Gómez C, Mitchell CA (2015) Tomatoes grown with light-emitting diodes or high-pressure sodium supplemental lights have similar fruit-quality attributes. HortScience 50:1498–1502
Franklin, K.A. (2008), Shade avoidance. New Phytologist, 179: 930-944. https://doi.org/10.1111/j.1469-8137.2008.02507.x
Hernández R, Kubota C (2016) Physiological responses of cucumber seedlings under different blue and red photon flux ratios using LEDs. Environ Exp Bot 121:66–74. doi: 10.1016/j.envexpbot.2015.04.001
Jin, D., Jin, S., & Chen, J. (2019). Cannabis indoor growing conditions, management practices, and post-harvest treatment: a review. American Journal of Plant Sciences, 10(06), 925.
Liu H, Fu Y, Hu D, et al (2018) Effect of green, yellow and purple radiation on biomass, photosynthesis, morphology and soluble sugar content of leafy lettuce via spectral wavebands “knock out.” Sci Hortic (Amsterdam) 236:10–17. doi: 10.1016/j.scienta.2018.03.027
Liu H, Fu Y, Wang M, Liu H (2017) Green light enhances growth, photosynthetic pigments and CO2assimilation efficiency of lettuce as revealed by ‘knock out’ of the 480–560 nm spectral waveband. Photosynthetica 55:144–152. doi: 10.1007/s11099-016-0233-7
McCree KJ (1972) The Action Spectrum, Absorbance and Quantum Yield of Photosynthesis in Crop Plants. Agric Meteorol 9:191–216. doi: 10.1016/0002-1571(71)90022-7
McKenney, D.W., Pedlar, J.H., Lawrence, K. et al. Updated plant hardiness zones for Canada and assessment of change over time. Sci Rep 15, 22774 (2025).
Miliauskiené, J.; Karlicek, R.F., Jr.; Kolmos, E. Effect of Multispectral Pulsed Light-Emitting Diodes on the Growth, Photosynthetic and Antioxidant Response of Baby Leaf Lettuce (Lactuca sativa L.). Plants 2021, 10, 762. https://doi.org/10.3390/plants10040762
Ouzounis T, Razi Parjikolaei B, Frette X, et al (2015) Predawn and high intensity application of supplemental blue light decreases the quantum yield of PSII and enhances the amount of phenolic acids, flavonoids, and pigments in Lactuca sativa. Front Plant Sci 6:1–14. doi: 10.3389/fpls.2015.00019
Piovene C, Orsini F, Bosi S, et al (2015) Optimal red:blue ratio in LED lighting for nutraceutical indoor horticulture. Sci Hortic (Amsterdam) 193:202–208. doi: 10.1016/j.scienta.2015.07.015
Shi C, Liu H (2021) How plants protect themselves from ultraviolet-B radiation stress. Plant Physiol. 2021 Nov 3;187(3):1096-1103. doi: 10.1093/plphys/kiab245
0 Comments