
Ian Ashdown, P. Eng., FIES, Senior Scientist, SunTracker Technologies Ltd.
Published: 2016/01/21
At first glance, this appears to be an innocuous question:
How much light pollution is attributable to automotive headlights?
It is also a good question in that if we are to address light pollution, we need to know what causes it. For this, we first need to look at the U.S. Department of Energy publication, 2010 U.S. Lighting Market Characterization (DOE 2010).
Section 4.2.4, Outdoor Results, tabulates the estimated number of outdoor lamps and their wattages nationwide by application in Tables 4.27 and 4.28 (Fig. 1), while Table C.2, System Efficacy Assumptions, tabulates the lamp efficacies (Table 1).
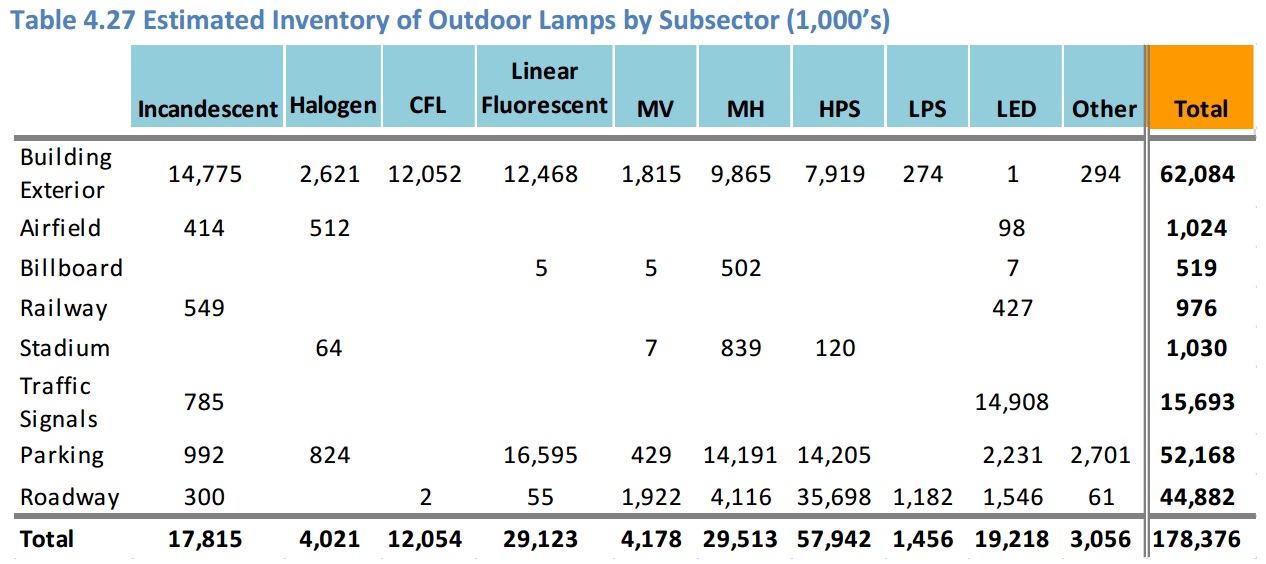

Fig. 1 – Estimated inventory of outdoor lamps. (Source: DOE 2010).
| Lamp Type | Luminous Efficacy (lm/W) |
| Incandescent | 12.2 |
| Halogen | 16.5 |
| CFL | 54.6 |
| Linear Fluorescent | 73.7 |
| Mercury Vapor | 30.5 |
| Metal Halide | 60.0 |
| High Pressure Sodium | 83.6 |
| Low Pressure Sodium | 89.2 |
| LED | 45.3 |
| Other | 75.8 |
Table 1 – System efficacy assumptions. (Source: DOE 2010).
With this information, we can estimate the relative lamp lumens per application (Fig. 3):
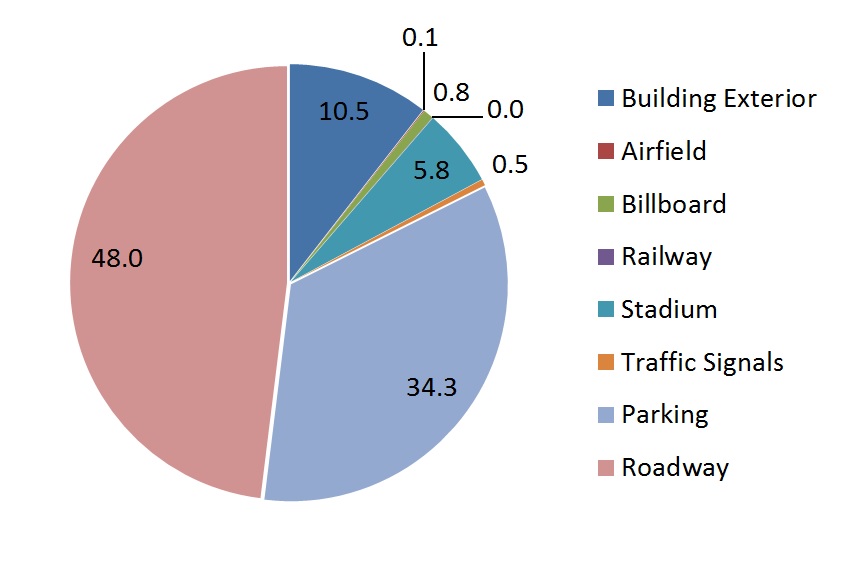
The interesting thing about this chart is that while the mix of lamp types has changed markedly since 2010 — LEDs are rapidly replacing high-pressure sodium (HPS) and metal halide (MH) lamps in roadway applications, for example — the relative lamp lumens by application should remain relatively constant[1].
With this, we can see that roadway lighting, outdoor parking lots, building exterior lighting, and stadium lighting contribute the most to light pollution on a per-lumen basis. Billboards (0.8 percent) and airfields (0.1 percent) may significantly impact surrounding residential neighborhoods, but they are mostly insignificant once you get outside of urban centers to dark-sky observing sites.
Automobiles
What the 2010 U.S. Lighting Market Characterization report does not address, of course, is automotive lighting, specifically headlamps. For this information, we have to go in search of data in order to synthesize an answer.
According to Wikipedia, the most common types of headlamps in North America are HB1/9004 dual-filament tungsten-halogen lamps, which generate 700 lumens, and high-intensity discharge (HID) lamps, which generate 2,800 to 3,500 lumens, both on low-beam. To this, we can add a growing number of LED and, in the future, laser headlamps.
Going forward, however, it is reasonable to assume that the average lumen output of an automotive headlamp will be approximately 3,000 lumens, giving 6,000 lumens per vehicle.
In calculating light pollution using various mathematical models such as those by Garstang (1986) and Aubé (2015), it is commonly assumed that the average person in urban environments requires between 1,000 and 1,500 lumens of outdoor lighting (i.e., per capita). At 6,000 lumens per vehicle, it is then reasonable to ask whether motor vehicles, including automobiles, contribute to light pollution.
The next part of the question is to ask how many vehicles there are per capita. Again, Wikipedia provides an answer: in the United States, there are 0.809 vehicles per capita. (As a curious aside, the miniscule microstate of the Most Serene Republic of San Marino has 1.263 vehicles per capita — over 41,000 of them in a country of 24 square miles that is surrounded by a relatively impoverished Italy.)
Now, however, comes the difficult part of the question: how many of these vehicles are on the road at any given time? This is not an easy question to answer. A common metric for transportation planners and engineers is the Annual Average Daily Traffic (AADT). This is determined in principle by counting all the vehicles on a highway or road for a year and then dividing by 365 days.
In practice, it is costly to install and maintain permanent automated traffic counters, and so portable automatic counters (those pneumatic tubes you sometimes see on the road) or traffic observers count vehicles for a few days in the year. There is then a fair amount of black magic applied (e.g., Ivan et al. 2002) to arrive at the estimated AADT.
What we are interested in, however, is the Average Daily Traffic (ADT) on an hourly basis. The transportation departments of most major cities collect this data for their major feeder routes, and quite often post the data online. The Province of British Columbia, for example, offers data from a hundred or so traffic counters throughout the province via their Traffic Data Program Web site.
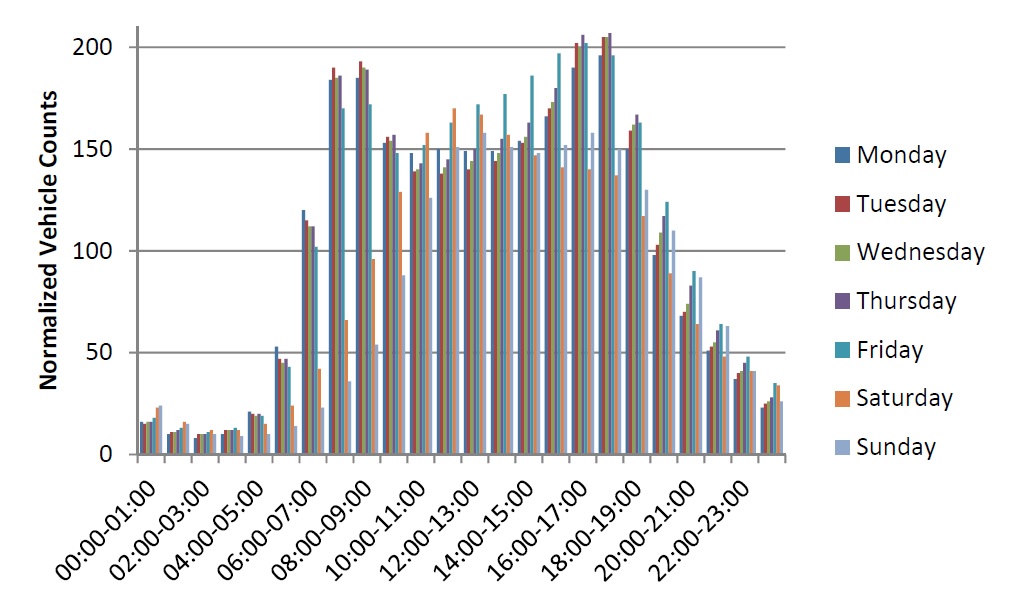
Agreed, this is too much information, but it does offer a fascinating insight into urban traffic patterns: they are almost identical on an hourly basis throughout the week, regardless of the city under consideration. A good example is the hourly traffic distribution for all roads in Great Britain in 2014, as reported by the United Kingdom Department for Transport (Fig. 4):
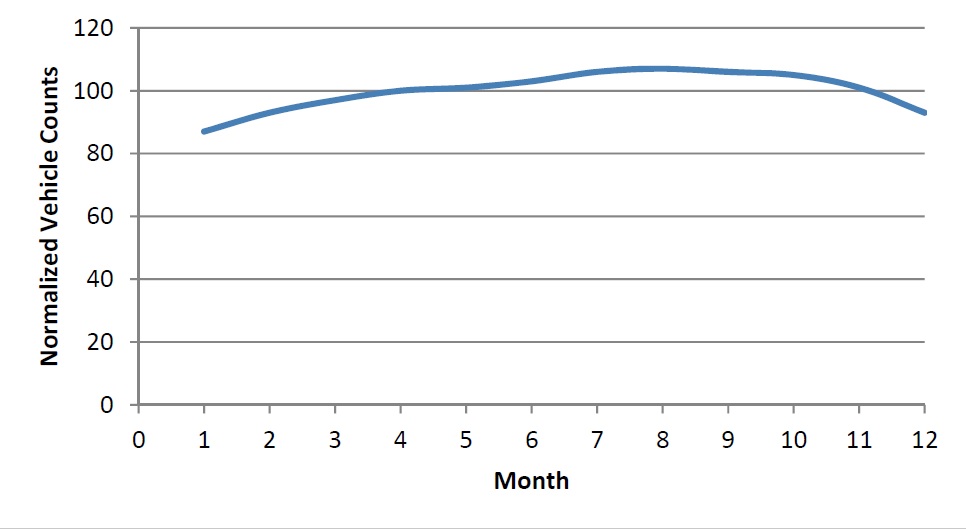
Equally surprising is that these numbers do not change significantly throughout the year (Fig. 5):
The problem, however, is that these traffic counts apply to single traffic counters. At best, all transportation engineers can do is to monitor the major roads and highways separating different sectors of a major urban center (collectively called “screenlines”) and estimate the traffic flow across them. What happens within these sectors with their hundreds to thousands of possible routes along municipal roads is anyone’s guess.
So, it is at this point that we have to make some ballpark estimates. We assume (admittedly with no supporting evidence) that the average urban commute time (round trip) per day is two hours, and that 50 percent of the 0.809 vehicles per capita in the United States are driven on any given day. Thus, at any given time, there are on average 0.809 * 0.5 * 2 hours / 24 hours = 0.033 vehicles per capita on the road at any given time.
With the normalized hourly traffic counts from Fig. 4 and these data and assumptions, we therefore have:
| Hour | Vehicles per Capita | Lumens per Capita |
| 00:00 — 01:00 | 0.006 | 36 |
| 01:00 — 02:00 | 0.004 | 25 |
| 02:00 — 03:00 | 0.003 | 20 |
| 03:00 — 04:00 | 0.004 | 23 |
| 04:00 — 05:00 | 0.006 | 35 |
| 05:00 — 06:00 | 0.013 | 77 |
| … | … | … |
| 17:00 — 18:00 | 0.061 | 367 |
| 18:00 — 19:00 | 0.049 | 296 |
| 19:00 — 20:00 | 0.035 | 212 |
| 20:00 — 21:00 | 0.025 | 152 |
| 21:00 — 22:00 | 0.019 | 112 |
| 22:00 — 23:00 | 0.014 | 83 |
| 23:00 — 24:00 | 0.009 | 56 |
Table 2 – Automotive lumens per capita and hour
How this table should be interpreted is a matter for debate — it depends on when astronomical twilight begins and ends (i.e., when the sun is 18 degrees below the horizon), and thus on both the time of the year and the observerís latitude. Apart from the winter months, it seems safe to say that automotive headlights contribute less than ten percent to light pollution after astronomical evening twilight.
What happens in San Marino is another question entirely.
Acknowledgements
Thanks to Dawn DeGrazio (Lighting Analysts, Inc.) for reviewing an earlier draft of this article.
References
Aubé, M. 2015. “Physical Behaviour of Anthropogenic Light Propagation into the Nocturnal Environment,” Philosophical Transactions of the Royal Society B 370(1667):20140117.
DOE. 2012. 2010 U.S. Lighting Market Characterization. U.S. Department of Energy Building Technologies Program.
Garstang, R. H. 1986. “Model for Artificial Night-Sky Illumination,” Publications of the Astronomical Society of the Pacific 98:364-375.
Ivan, J. N., W. E. ElDessouki, M. Zhao, and F. Guo. 2002. Estimating Link Traffic Volumes by Month, Day of Week, and Time of Day. Technical Report JHR 02-287, Connecticut Transportation Institute, University of Connecticut.
[1] LED luminaire efficiencies are typically better than their fluorescent and HID counterparts, but these will in general be similar across all applications.
0 Comments